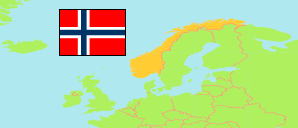
Buskerud
County in Norway
Contents: Subdivision
The population development in Buskerud as well as related information and services (Wikipedia, Google, images).
| Name | Status | Population Estimate 1986-01-01 | Population Estimate 1993-01-01 | Population Estimate 2000-01-01 | Population Estimate 2006-01-01 | Population Estimate 2013-01-01 | Population Estimate 2020-01-01 | Population Estimate 2024-01-01 | |
|---|---|---|---|---|---|---|---|---|---|
| Buskerud | County | 204,038 | 209,631 | 218,487 | 225,183 | 246,174 | 259,626 | 269,819 | |
| Ål | Municipality | 4,669 | 4,882 | 4,789 | 4,662 | 4,761 | 4,674 | 5,007 | → |
| Drammen | Municipality | 74,534 | 77,216 | 81,602 | 85,877 | 95,683 | 101,386 | 104,487 | → |
| Flå | Municipality | 1,267 | 1,171 | 1,102 | 998 | 1,050 | 1,050 | 1,115 | → |
| Flesberg | Municipality | 2,531 | 2,532 | 2,491 | 2,529 | 2,657 | 2,688 | 2,781 | → |
| Gol | Municipality | 4,064 | 4,307 | 4,390 | 4,404 | 4,667 | 4,608 | 4,986 | → |
| Hemsedal | Municipality | 1,626 | 1,637 | 1,958 | 1,947 | 2,224 | 2,486 | 2,666 | → |
| Hol | Municipality | 4,656 | 4,618 | 4,642 | 4,500 | 4,448 | 4,441 | 4,496 | → |
| Hole | Municipality | 4,236 | 4,573 | 4,977 | 5,307 | 6,463 | 6,799 | 6,989 | → |
| Kongsberg | Municipality | 21,060 | 21,258 | 22,293 | 23,315 | 25,887 | 27,723 | 28,848 | → |
| Krødsherad | Municipality | 2,342 | 2,321 | 2,254 | 2,127 | 2,223 | 2,212 | 2,241 | → |
| Lier | Municipality | 18,348 | 19,264 | 21,308 | 21,874 | 24,763 | 26,811 | 28,470 | → |
| Modum | Municipality | 12,184 | 12,246 | 12,366 | 12,585 | 13,337 | 14,115 | 14,665 | → |
| Nesbyen | Municipality | 3,388 | 3,409 | 3,528 | 3,524 | 3,435 | 3,273 | 3,301 | → |
| Nore og Uvdal | Municipality | 2,984 | 2,898 | 2,764 | 2,597 | 2,531 | 2,439 | 2,486 | → |
| Øvre Eiker | Municipality | 14,112 | 14,754 | 15,058 | 15,825 | 17,752 | 19,423 | 20,779 | → |
| Ringerike | Municipality | 26,797 | 27,374 | 27,917 | 28,197 | 29,400 | 30,641 | 31,581 | → |
| Rollag | Municipality | 1,440 | 1,476 | 1,492 | 1,414 | 1,355 | 1,390 | 1,395 | → |
| Sigdal | Municipality | 3,800 | 3,695 | 3,556 | 3,501 | 3,538 | 3,467 | 3,526 | → |
| Norge (Noreg) [Norway] | Kingdom | 4,159,187 | 4,299,167 | 4,478,497 | 4,640,219 | 5,051,275 | 5,367,580 | 5,550,203 |
Source: Statistics Norway.
Explanation: Counties according to the reestablishment of former counties by 1 January 2024.
Further information about the population structure:
| Gender (E 2024) | |
|---|---|
| Males | 135,971 |
| Females | 133,848 |
| Age Groups (E 2024) | |
|---|---|
| 0-17 years | 52,903 |
| 18-64 years | 163,029 |
| 65+ years | 53,887 |
| Age Distribution (E 2024) | |
|---|---|
| 90+ years | 2,312 |
| 80-89 years | 10,902 |
| 70-79 years | 25,650 |
| 60-69 years | 31,264 |
| 50-59 years | 37,817 |
| 40-49 years | 36,478 |
| 30-39 years | 36,063 |
| 20-29 years | 29,804 |
| 10-19 years | 32,462 |
| 0-9 years | 27,067 |
| Citizenship (E 2024) | |
|---|---|
| Norway | 343,807 |
| Country of Birth (E 2024) | |
|---|---|
| Norway | 214,086 |
| Europe | 30,782 |
| Africa | 5,473 |
| Asia | 16,882 |
| Other country | 2,596 |