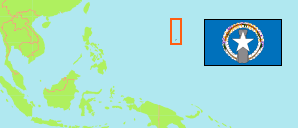
San Jose
Village in Northern Mariana Islands
Contents: Population
The population development of San Jose as well as related information and services (Wikipedia, Google, images).
| Name | Status | Population Census 2000-04-01 | Population Census 2010-04-01 | Population Census 2020-04-01 | |
|---|---|---|---|---|---|
| San Jose | Village | ... | 1,939 | 1,250 | |
| Northern Mariana Islands | Commonwealth | 69,221 | 53,883 | 47,329 |
Source: U.S. Census Bureau (web), CNMI Central Statistics Division (web).
Further information about the population structure:
| Gender (C 2020) | |
|---|---|
| Males | 671 |
| Females | 579 |
| Age Groups (C 2020) | |
|---|---|
| 0-17 years | 359 |
| 18-64 years | 820 |
| 65+ years | 71 |
| Age Distribution (C 2020) | |
|---|---|
| 80+ years | 3 |
| 70-79 years | 24 |
| 60-69 years | 122 |
| 50-59 years | 230 |
| 40-49 years | 192 |
| 30-39 years | 177 |
| 20-29 years | 109 |
| 10-19 years | 205 |
| 0-9 years | 188 |
| »Race« (C 2020) | |
|---|---|
| Chamorro | 486 |
| Other Pacific Islander | 49 |
| Filipino | 445 |
| Other Asian | 144 |
| White | 10 |
| Some other | 3 |
| 2 or more | 113 |