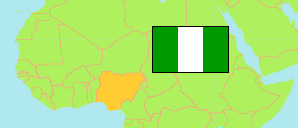
Sokoto
State in Nigeria
Contents: Subdivision
The population development in Sokoto as well as related information and services (Wikipedia, Google, images).
| Name | Status | Population Census 1991-11-26 | Population Census 2006-03-21 | Population Projection 2022-03-21 | |
|---|---|---|---|---|---|
| Sokoto | State | 2,418,585 | 3,702,676 | 6,391,000 | |
| Binji | Local Government Area | 54,239 | 104,274 | 180,000 | → |
| Bodinga | Local Government Area | 114,067 | 174,302 | 300,900 | → |
| Dange Shuni | Local Government Area | ... | 193,443 | 333,900 | → |
| Gada | Local Government Area | 147,915 | 249,051 | 429,900 | → |
| Goronyo | Local Government Area | 106,666 | 182,118 | 314,300 | → |
| Gudu | Local Government Area | ... | 95,400 | 164,700 | → |
| Gwadabawa | Local Government Area | 142,996 | 231,569 | 399,700 | → |
| Illela | Local Government Area | 131,930 | 150,133 | 259,100 | → |
| Isa | Local Government Area | ... | 150,268 | 259,400 | → |
| Kebbe | Local Government Area | ... | 123,154 | 212,600 | → |
| Kware | Local Government Area | 116,139 | 134,084 | 231,400 | → |
| Rabah | Local Government Area | 91,119 | 149,152 | 257,400 | → |
| Sabon Birni | Local Government Area | 152,994 | 207,470 | 358,100 | → |
| Shagari | Local Government Area | ... | 156,907 | 270,800 | → |
| Silame | Local Government Area | 65,122 | 104,601 | 180,500 | → |
| Sokoto North | Local Government Area | ... | 233,012 | 402,200 | → |
| Sokoto South | Local Government Area | ... | 197,686 | 341,200 | → |
| Tambuwal | Local Government Area | 146,976 | 225,917 | 389,900 | → |
| Tangaza | Local Government Area | ... | 114,770 | 198,100 | → |
| Tureta | Local Government Area | ... | 68,414 | 118,100 | → |
| Wamakko | Local Government Area | 140,137 | 179,246 | 309,400 | → |
| Wurno | Local Government Area | 100,964 | 162,403 | 280,300 | → |
| Yabo | Local Government Area | ... | 115,302 | 199,000 | → |
| Nigeria | Federal Republic | 88,992,220 | 140,431,790 | 216,783,400 |
Source: National Population Commission of Nigeria (web), National Bureau of Statistics (web).
Explanation: The population projection assumes the same rate of growth for all LGAs within a state. The undercount of the 1991 census is estimated to be about 25 million. All population figures for Nigeria show high error rates; census results are disputed. Area figures are computed using geospatial data.
Further information about the population structure:
| Gender (C 2006) | |
|---|---|
| Males | 1,863,713 |
| Females | 1,838,963 |
| Age Groups (C 2006) | |
|---|---|
| 0-14 years | 1,759,317 |
| 15-64 years | 1,835,466 |
| 65+ years | 107,893 |
| Age Distribution (C 2006) | |
|---|---|
| 0-9 years | 1,355,821 |
| 10-19 years | 755,516 |
| 20-29 years | 598,808 |
| 30-39 years | 408,314 |
| 40-49 years | 253,737 |
| 50-59 years | 155,306 |
| 60-69 years | 89,435 |
| 70-79 years | 48,344 |
| 80+ years | 37,395 |