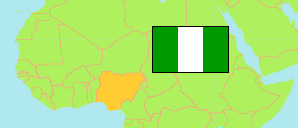
Plateau
State in Nigeria
Contents: Subdivision
The population development in Plateau as well as related information and services (Wikipedia, Google, images).
| Name | Status | Population Census 1991-11-26 | Population Census 2006-03-21 | Population Projection 2022-03-21 | |
|---|---|---|---|---|---|
| Plateau | State | 2,104,536 | 3,206,531 | 4,717,300 | |
| Barkin Ladi | Local Government Area | ... | 179,805 | 264,500 | → |
| Bassa | Local Government Area | 121,652 | 189,834 | 279,300 | → |
| Bokkos | Local Government Area | 95,218 | 179,550 | 264,100 | → |
| Jos East | Local Government Area | ... | 88,301 | 129,900 | → |
| Jos North | Local Government Area | ... | 437,217 | 643,200 | → |
| Jos South | Local Government Area | 237,408 | 311,392 | 458,100 | → |
| Kanam | Local Government Area | 113,500 | 167,619 | 246,600 | → |
| Kanke | Local Government Area | ... | 124,268 | 182,800 | → |
| Langtang North | Local Government Area | 94,707 | 142,316 | 209,400 | → |
| Langtang South | Local Government Area | 47,108 | 105,173 | 154,700 | → |
| Mangu | Local Government Area | 187,397 | 300,520 | 442,100 | → |
| Mikang | Local Government Area | ... | 96,388 | 141,800 | → |
| Pankshin | Local Government Area | ... | 190,114 | 279,700 | → |
| Qua'an Pan | Local Government Area | 141,082 | 197,276 | 290,200 | → |
| Riyom | Local Government Area | ... | 131,778 | 193,900 | → |
| Shendam | Local Government Area | ... | 205,119 | 301,800 | → |
| Wase | Local Government Area | 102,336 | 159,861 | 235,200 | → |
| Nigeria | Federal Republic | 88,992,220 | 140,431,790 | 216,783,400 |
Source: National Population Commission of Nigeria (web), National Bureau of Statistics (web).
Explanation: The population projection assumes the same rate of growth for all LGAs within a state. The undercount of the 1991 census is estimated to be about 25 million. All population figures for Nigeria show high error rates; census results are disputed. Area figures are computed using geospatial data.
Further information about the population structure:
| Gender (C 2006) | |
|---|---|
| Males | 1,598,998 |
| Females | 1,607,533 |
| Age Groups (C 2006) | |
|---|---|
| 0-14 years | 1,411,031 |
| 15-64 years | 1,687,381 |
| 65+ years | 108,119 |
| Age Distribution (C 2006) | |
|---|---|
| 0-9 years | 1,030,393 |
| 10-19 years | 724,539 |
| 20-29 years | 575,677 |
| 30-39 years | 368,130 |
| 40-49 years | 228,122 |
| 50-59 years | 125,657 |
| 60-69 years | 72,348 |
| 70-79 years | 44,563 |
| 80+ years | 37,102 |