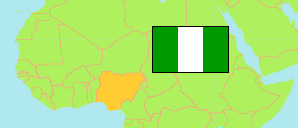
Oyo
State in Nigeria
Contents: Subdivision
The population development in Oyo as well as related information and services (Wikipedia, Google, images).
| Name | Status | Population Census 1991-11-26 | Population Census 2006-03-21 | Population Projection 2022-03-21 | |
|---|---|---|---|---|---|
| Oyo | State | 3,452,720 | 5,580,894 | 7,976,100 | |
| Afijio | Local Government Area | 82,792 | 132,184 | 188,900 | → |
| Akinyele | Local Government Area | 140,118 | 211,811 | 302,700 | → |
| Atiba | Local Government Area | ... | 168,246 | 240,500 | → |
| Atisbo | Local Government Area | ... | 109,965 | 157,200 | → |
| Egbeda | Local Government Area | 129,461 | 283,643 | 405,400 | → |
| Ibadan North | Local Government Area | 302,271 | 308,119 | 440,400 | → |
| Ibadan North East | Local Government Area | 275,627 | 331,444 | 473,700 | → |
| Ibadan North West | Local Government Area | 147,918 | 154,029 | 220,100 | → |
| Ibadan South East | Local Government Area | 225,800 | 266,457 | 380,800 | → |
| Ibadan South West | Local Government Area | 277,047 | 283,098 | 404,600 | → |
| Ibarapa Central | Local Government Area | ... | 103,243 | 147,600 | → |
| Ibarapa East | Local Government Area | ... | 117,182 | 167,500 | → |
| Ibarapa North | Local Government Area | ... | 100,293 | 143,300 | → |
| Ido | Local Government Area | 53,582 | 104,087 | 148,800 | → |
| Irepo | Local Government Area | ... | 121,240 | 173,300 | → |
| Iseyin | Local Government Area | 170,936 | 255,619 | 365,300 | → |
| Itesiwaju | Local Government Area | ... | 127,391 | 182,100 | → |
| Iwajowa | Local Government Area | ... | 102,847 | 147,000 | → |
| Kajola | Local Government Area | ... | 200,528 | 286,600 | → |
| Lagelu | Local Government Area | 68,901 | 148,133 | 211,700 | → |
| Ogbomosho North | Local Government Area | 104,295 | 198,859 | 284,200 | → |
| Ogbomosho South | Local Government Area | 65,958 | 100,379 | 143,500 | → |
| Ogo Oluwa | Local Government Area | 36,188 | 65,198 | 93,200 | → |
| Olorunsogo | Local Government Area | ... | 81,339 | 116,200 | → |
| Oluyole | Local Government Area | 91,527 | 203,461 | 290,800 | → |
| Ona-Ara | Local Government Area | 123,048 | 265,571 | 379,500 | → |
| Orelope | Local Government Area | 68,566 | 104,004 | 148,600 | → |
| Ori Ire | Local Government Area | 103,611 | 149,408 | 213,500 | → |
| Oyo East | Local Government Area | ... | 124,095 | 177,400 | → |
| Oyo West | Local Government Area | ... | 136,457 | 195,000 | → |
| Saki East | Local Government Area | ... | 108,957 | 155,700 | → |
| Saki West | Local Government Area | ... | 273,268 | 390,500 | → |
| Surulere | Local Government Area | 64,097 | 140,339 | 200,600 | → |
| Nigeria | Federal Republic | 88,992,220 | 140,431,790 | 216,783,400 |
Source: National Population Commission of Nigeria (web), National Bureau of Statistics (web).
Explanation: The population projection assumes the same rate of growth for all LGAs within a state. The undercount of the 1991 census is estimated to be about 25 million. All population figures for Nigeria show high error rates; census results are disputed. Area figures are computed using geospatial data.
Further information about the population structure:
| Gender (C 2006) | |
|---|---|
| Males | 2,802,432 |
| Females | 2,778,462 |
| Age Groups (C 2006) | |
|---|---|
| 0-14 years | 2,099,694 |
| 15-64 years | 3,267,397 |
| 65+ years | 213,803 |
| Age Distribution (C 2006) | |
|---|---|
| 0-9 years | 1,443,194 |
| 10-19 years | 1,252,424 |
| 20-29 years | 1,047,008 |
| 30-39 years | 713,492 |
| 40-49 years | 500,551 |
| 50-59 years | 296,924 |
| 60-69 years | 177,194 |
| 70-79 years | 87,065 |
| 80+ years | 63,042 |