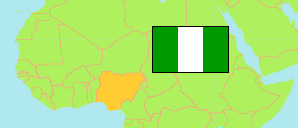
Niger
State in Nigeria
Contents: Subdivision
The population development in Niger as well as related information and services (Wikipedia, Google, images).
| Name | Status | Population Census 1991-11-26 | Population Census 2006-03-21 | Population Projection 2022-03-21 | |
|---|---|---|---|---|---|
| Niger | State | 2,421,581 | 3,954,772 | 6,783,300 | |
| Agaie | Local Government Area | 79,937 | 132,098 | 226,600 | → |
| Agwara | Local Government Area | 38,916 | 57,347 | 98,400 | → |
| Bida | Local Government Area | ... | 185,553 | 318,300 | → |
| Borgu | Local Government Area | 110,336 | 172,835 | 296,500 | → |
| Bosso | Local Government Area | 86,273 | 148,136 | 254,100 | → |
| Chanchaga | Local Government Area | 143,896 | 202,151 | 346,700 | → |
| Edati | Local Government Area | ... | 159,818 | 274,100 | → |
| Gbako | Local Government Area | 88,768 | 126,845 | 217,600 | → |
| Gurara | Local Government Area | 48,903 | 90,879 | 155,900 | → |
| Katcha | Local Government Area | ... | 120,893 | 207,400 | → |
| Kontagora | Local Government Area | ... | 151,968 | 260,700 | → |
| Lapai | Local Government Area | 73,647 | 117,021 | 200,700 | → |
| Lavun | Local Government Area | ... | 209,777 | 359,800 | → |
| Magama | Local Government Area | 129,749 | 181,470 | 311,300 | → |
| Mariga | Local Government Area | ... | 199,600 | 342,400 | → |
| Mashegu | Local Government Area | ... | 215,197 | 369,100 | → |
| Mokwa | Local Government Area | 98,234 | 242,858 | 416,600 | → |
| Muya | Local Government Area | ... | 103,461 | 177,500 | → |
| Paikoro | Local Government Area | 109,356 | 158,178 | 271,300 | → |
| Rafi | Local Government Area | 116,948 | 186,118 | 319,200 | → |
| Rijau | Local Government Area | 122,050 | 176,199 | 302,200 | → |
| Shiroro | Local Government Area | ... | 235,665 | 404,200 | → |
| Suleja | Local Government Area | 151,300 | 215,075 | 368,900 | → |
| Tafa | Local Government Area | ... | 83,874 | 143,900 | → |
| Wushishi | Local Government Area | ... | 81,756 | 140,200 | → |
| Nigeria | Federal Republic | 88,992,220 | 140,431,790 | 216,783,400 |
Source: National Population Commission of Nigeria (web), National Bureau of Statistics (web).
Explanation: The population projection assumes the same rate of growth for all LGAs within a state. The undercount of the 1991 census is estimated to be about 25 million. All population figures for Nigeria show high error rates; census results are disputed. Area figures are computed using geospatial data.
Further information about the population structure:
| Gender (C 2006) | |
|---|---|
| Males | 2,004,350 |
| Females | 1,950,422 |
| Age Groups (C 2006) | |
|---|---|
| 0-14 years | 1,857,615 |
| 15-64 years | 1,989,969 |
| 65+ years | 107,188 |
| Age Distribution (C 2006) | |
|---|---|
| 0-9 years | 1,414,213 |
| 10-19 years | 834,577 |
| 20-29 years | 686,509 |
| 30-39 years | 447,630 |
| 40-49 years | 267,056 |
| 50-59 years | 143,272 |
| 60-69 years | 78,252 |
| 70-79 years | 43,023 |
| 80+ years | 40,240 |