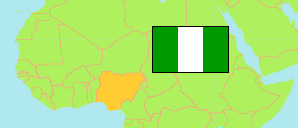
Kwara
State in Nigeria
Contents: Subdivision
The population development in Kwara as well as related information and services (Wikipedia, Google, images).
| Name | Status | Population Census 1991-11-26 | Population Census 2006-03-21 | Population Projection 2022-03-21 | |
|---|---|---|---|---|---|
| Kwara | State | 1,548,412 | 2,365,353 | 3,551,000 | |
| Asa | Local Government Area | 78,722 | 124,668 | 187,200 | → |
| Baruten | Local Government Area | 110,576 | 206,679 | 310,300 | → |
| Edu | Local Government Area | 138,735 | 201,642 | 302,700 | → |
| Ekiti | Local Government Area | ... | 54,399 | 81,700 | → |
| Ifelodun | Local Government Area | 155,551 | 204,975 | 307,700 | → |
| Ilorin East | Local Government Area | ... | 207,462 | 311,500 | → |
| Ilorin South | Local Government Area | ... | 209,251 | 314,100 | → |
| Ilorin West | Local Government Area | 205,567 | 365,221 | 548,300 | → |
| Irepodun | Local Government Area | ... | 147,594 | 221,600 | → |
| Isin | Local Government Area | ... | 59,481 | 89,300 | → |
| Kaiama | Local Government Area | 43,165 | 124,015 | 186,200 | → |
| Moro | Local Government Area | 86,939 | 108,715 | 163,200 | → |
| Offa | Local Government Area | 74,924 | 88,975 | 133,600 | → |
| Oke-Ero | Local Government Area | ... | 56,970 | 85,500 | → |
| Oyun | Local Government Area | 56,006 | 94,454 | 141,800 | → |
| Pategi | Local Government Area | ... | 110,852 | 166,400 | → |
| Nigeria | Federal Republic | 88,992,220 | 140,431,790 | 216,783,400 |
Source: National Population Commission of Nigeria (web), National Bureau of Statistics (web).
Explanation: The population projection assumes the same rate of growth for all LGAs within a state. The undercount of the 1991 census is estimated to be about 25 million. All population figures for Nigeria show high error rates; census results are disputed. Area figures are computed using geospatial data.
Further information about the population structure:
| Gender (C 2006) | |
|---|---|
| Males | 1,193,783 |
| Females | 1,171,570 |
| Age Groups (C 2006) | |
|---|---|
| 0-14 years | 1,030,799 |
| 15-64 years | 1,259,618 |
| 65+ years | 74,936 |
| Age Distribution (C 2006) | |
|---|---|
| 0-9 years | 757,872 |
| 10-19 years | 516,234 |
| 20-29 years | 417,835 |
| 30-39 years | 270,993 |
| 40-49 years | 182,812 |
| 50-59 years | 103,508 |
| 60-69 years | 61,844 |
| 70-79 years | 30,859 |
| 80+ years | 23,396 |