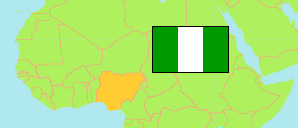
Delta
State in Nigeria
Contents: Subdivision
The population development in Delta as well as related information and services (Wikipedia, Google, images).
| Name | Status | Population Census 1991-11-26 | Population Census 2006-03-21 | Population Projection 2022-03-21 | |
|---|---|---|---|---|---|
| Delta | State | 2,590,491 | 4,112,445 | 5,636,100 | |
| Aniocha North | Local Government Area | 60,998 | 104,062 | 142,600 | → |
| Aniocha South | Local Government Area | 107,034 | 142,045 | 194,700 | → |
| Bomadi | Local Government Area | ... | 86,016 | 117,900 | → |
| Burutu | Local Government Area | 167,648 | 207,977 | 285,000 | → |
| Ethiope East | Local Government Area | 113,929 | 200,942 | 275,400 | → |
| Ethiope West | Local Government Area | 105,861 | 202,712 | 277,800 | → |
| Ika North East | Local Government Area | 126,560 | 182,819 | 250,600 | → |
| Ika South | Local Government Area | 109,204 | 167,060 | 229,000 | → |
| Isoko North | Local Government Area | 111,919 | 143,559 | 196,700 | → |
| Isoko South | Local Government Area | 150,836 | 235,147 | 322,300 | → |
| Ndokwa East | Local Government Area | 75,578 | 103,224 | 141,500 | → |
| Ndokwa West | Local Government Area | ... | 150,024 | 205,600 | → |
| Okpe | Local Government Area | ... | 128,398 | 176,000 | → |
| Oshimili North | Local Government Area | ... | 118,540 | 162,500 | → |
| Oshimili South | Local Government Area | ... | 150,032 | 205,600 | → |
| Patani | Local Government Area | ... | 67,391 | 92,400 | → |
| Sapele | Local Government Area | 142,652 | 174,273 | 238,800 | → |
| Udu | Local Government Area | ... | 142,480 | 195,300 | → |
| Ughelli North | Local Government Area | 166,029 | 320,687 | 439,500 | → |
| Ughelli South | Local Government Area | 139,748 | 212,638 | 291,400 | → |
| Ukwuani | Local Government Area | ... | 119,034 | 163,100 | → |
| Uvwie | Local Government Area | ... | 188,728 | 258,700 | → |
| Warri North | Local Government Area | 90,893 | 136,149 | 186,600 | → |
| Warri South | Local Government Area | 235,750 | 311,970 | 427,600 | → |
| Warri South West | Local Government Area | ... | 116,538 | 159,700 | → |
| Nigeria | Federal Republic | 88,992,220 | 140,431,790 | 216,783,400 |
Source: National Population Commission of Nigeria (web), National Bureau of Statistics (web).
Explanation: The population projection assumes the same rate of growth for all LGAs within a state. The undercount of the 1991 census is estimated to be about 25 million. All population figures for Nigeria show high error rates; census results are disputed. Area figures are computed using geospatial data.
Further information about the population structure:
| Gender (C 2006) | |
|---|---|
| Males | 2,069,309 |
| Females | 2,043,136 |
| Age Groups (C 2006) | |
|---|---|
| 0-14 years | 1,538,613 |
| 15-64 years | 2,405,793 |
| 65+ years | 168,039 |
| Age Distribution (C 2006) | |
|---|---|
| 0-9 years | 1,048,815 |
| 10-19 years | 961,043 |
| 20-29 years | 776,061 |
| 30-39 years | 501,196 |
| 40-49 years | 359,946 |
| 50-59 years | 218,817 |
| 60-69 years | 123,959 |
| 70-79 years | 70,101 |
| 80+ years | 52,507 |