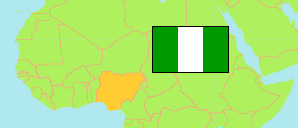
Borno
State in Nigeria
Contents: Subdivision
The population development in Borno as well as related information and services (Wikipedia, Google, images).
| Name | Status | Population Census 1991-11-26 | Population Census 2006-03-21 | Population Projection 2022-03-21 | |
|---|---|---|---|---|---|
| Borno | State | 2,536,003 | 4,171,104 | 6,111,500 | |
| Abadam | Local Government Area | ... | 100,065 | 146,600 | → |
| Askira/Uba | Local Government Area | ... | 143,313 | 210,000 | → |
| Bama | Local Government Area | 195,377 | 270,119 | 395,800 | → |
| Bayo | Local Government Area | ... | 79,078 | 115,900 | → |
| Biu | Local Government Area | 109,253 | 175,760 | 257,500 | → |
| Chibok | Local Government Area | ... | 66,333 | 97,200 | → |
| Damboa | Local Government Area | 137,824 | 233,200 | 341,700 | → |
| Dikwa | Local Government Area | 75,760 | 105,042 | 153,900 | → |
| Gubio | Local Government Area | 43,589 | 151,286 | 221,700 | → |
| Guzamala | Local Government Area | ... | 95,991 | 140,600 | → |
| Gwoza | Local Government Area | 145,868 | 276,568 | 405,200 | → |
| Hawul | Local Government Area | 86,964 | 120,733 | 176,900 | → |
| Jere | Local Government Area | ... | 209,107 | 306,400 | → |
| Kaga | Local Government Area | 51,971 | 89,996 | 131,900 | → |
| Kala/Balge | Local Government Area | ... | 60,834 | 89,100 | → |
| Konduga | Local Government Area | ... | 157,322 | 230,500 | → |
| Kukawa | Local Government Area | ... | 203,343 | 297,900 | → |
| Kwaya Kusar | Local Government Area | ... | 56,704 | 83,100 | → |
| Mafa | Local Government Area | 45,436 | 103,600 | 151,800 | → |
| Magumeri | Local Government Area | 53,068 | 140,257 | 205,500 | → |
| Maiduguri | Local Government Area | ... | 540,016 | 791,200 | → |
| Marte | Local Government Area | 59,907 | 129,409 | 189,600 | → |
| Mobbar | Local Government Area | ... | 116,633 | 170,900 | → |
| Monguno | Local Government Area | 68,510 | 109,834 | 160,900 | → |
| Ngala | Local Government Area | ... | 236,498 | 346,500 | → |
| Nganzai | Local Government Area | 30,861 | 99,074 | 145,200 | → |
| Shani | Local Government Area | 66,264 | 100,989 | 148,000 | → |
| Nigeria | Federal Republic | 88,992,220 | 140,431,790 | 216,783,400 |
Source: National Population Commission of Nigeria (web), National Bureau of Statistics (web).
Explanation: The population projection assumes the same rate of growth for all LGAs within a state. The undercount of the 1991 census is estimated to be about 25 million. All population figures for Nigeria show high error rates; census results are disputed. Area figures are computed using geospatial data.
Further information about the population structure:
| Gender (C 2006) | |
|---|---|
| Males | 2,163,358 |
| Females | 2,007,746 |
| Age Groups (C 2006) | |
|---|---|
| 0-14 years | 1,931,360 |
| 15-64 years | 2,118,849 |
| 65+ years | 120,895 |
| Age Distribution (C 2006) | |
|---|---|
| 0-9 years | 1,466,970 |
| 10-19 years | 872,705 |
| 20-29 years | 708,198 |
| 30-39 years | 464,937 |
| 40-49 years | 296,496 |
| 50-59 years | 167,596 |
| 60-69 years | 97,457 |
| 70-79 years | 53,783 |
| 80+ years | 42,962 |