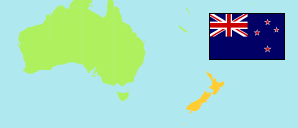
West Coast
Regional Council Area in South Island
Regional Council Area
The population development of West Coast.
| Name | Status | Population Estimate 1996-06-30 | Population Estimate 2001-06-30 | Population Estimate 2006-06-30 | Population Estimate 2013-06-30 | Population Estimate 2018-06-30 | Population Estimate 2022-06-30 | |
|---|---|---|---|---|---|---|---|---|
| West Coast | Regional Council Area | 33,200 | 31,100 | 32,100 | 33,000 | 32,400 | 32,700 | → |
| South Island (Te Waipounamu) | Island | 921,100 | 935,400 | 998,800 | 1,042,800 | 1,146,200 | 1,201,300 |
Contents: Settlements
The population development of the settlements in West Coast.
| Name | Status | Region | Population Estimate 1996-06-30 | Population Estimate 2001-06-30 | Population Estimate 2006-06-30 | Population Estimate 2013-06-30 | Population Estimate 2018-06-30 | Population Estimate 2022-06-30 | |
|---|---|---|---|---|---|---|---|---|---|
| Ahaura | Rural Settlement | West Coast | 120 | 140 | 110 | 100 | 100 | 110 | → |
| Blackball | Rural Settlement | West Coast | 370 | 310 | 320 | 290 | 280 | 290 | → |
| Carters Beach | Rural Settlement | West Coast | 310 | 280 | 310 | 340 | 340 | 340 | → |
| Dobson | Rural Settlement | West Coast | 600 | 620 | 600 | 580 | 580 | 600 | → |
| Fox Glacier | Rural Settlement | West Coast | 190 | 200 | 290 | 240 | 260 | 240 | → |
| Franz Josef | Rural Settlement | West Coast | 210 | 220 | 300 | 350 | 500 | 510 | → |
| Gloriavale | Rural Settlement | West Coast | 240 | 300 | 370 | 530 | 630 | 700 | → |
| Granity | Rural Settlement | West Coast | 280 | 220 | 190 | 210 | 170 | 160 | → |
| Greymouth | Small Urban Area | West Coast | 8,760 | 8,150 | 8,410 | 8,320 | 8,230 | 8,320 | → |
| Haast | Rural Settlement | West Coast | 60 | 60 | 60 | 50 | 90 | 90 | → |
| Harihari | Rural Settlement | West Coast | 290 | 270 | 270 | 250 | 240 | 260 | → |
| Hokitika | Small Urban Area | West Coast | 3,420 | 3,170 | 3,150 | 3,060 | 2,960 | 2,860 | → |
| Kaniere | Rural Settlement | West Coast | 270 | 240 | 300 | 310 | 300 | 290 | → |
| Karamea | Rural Settlement | West Coast | 470 | 460 | 430 | 380 | 360 | 400 | → |
| Kūmara | Rural Settlement | West Coast | 320 | 330 | 320 | 310 | 290 | 290 | → |
| Moana | Rural Settlement | West Coast | 140 | 80 | 60 | 70 | 60 | 70 | → |
| Ngākawau | Rural Settlement | West Coast | 360 | 310 | 240 | 220 | 200 | 190 | → |
| Reefton | Small Urban Area | West Coast | 1,100 | 1,030 | 1,000 | 1,070 | 940 | 930 | → |
| Ross | Rural Settlement | West Coast | 390 | 320 | 300 | 300 | 290 | 280 | → |
| Rūnanga | Small Urban Area | West Coast | 1,430 | 1,340 | 1,260 | 1,270 | 1,220 | 1,240 | → |
| Waimangaroa | Rural Settlement | West Coast | 290 | 230 | 230 | 250 | 230 | 220 | → |
| Westport | Small Urban Area | West Coast | 4,980 | 4,530 | 4,620 | 4,850 | 4,520 | 4,290 | → |
Source: Statistics New Zealand / Te Tari Tatau (web).
Explanation: Settlements in 2022 boundaries. Population estimates for 2018 and later are based on the results of the 2018 census. The 2022 figures are provisional.