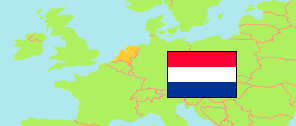
Beverwijk
Municipality in Noord-Holland (Netherlands)
Contents: Population
The population development of Beverwijk as well as related information and services (Wikipedia, Google, images).
| Name | Status | Population Census 2001-01-01 | Population Estimate 2008-01-01 | Population Estimate 2011-01-01 | Population Estimate 2018-01-01 | Population Estimate 2024-01-01 | |
|---|---|---|---|---|---|---|---|
| Beverwijk | Municipality | 35,937 | 37,347 | 39,329 | 41,077 | 42,893 | |
| Nederland [Netherlands] | Country | 15,985,538 | 16,405,399 | 16,655,799 | 17,181,084 | 17,947,684 |
Source: Statistics Netherlands.
Explanation: Provinces and municipalities in the boundaries of 1 January 2024. 2024 population figures are preliminary.
Further information about the population structure:
| Gender (E 2023) | |
|---|---|
| Males | 21,467 |
| Females | 21,244 |
| Age Groups (E 2023) | |
|---|---|
| 0-17 years | 8,074 |
| 18-64 years | 26,609 |
| 65+ years | 8,028 |
| Age Distribution (E 2023) | |
|---|---|
| 90+ years | 355 |
| 80-89 years | 1,608 |
| 70-79 years | 3,787 |
| 60-69 years | 5,109 |
| 50-59 years | 6,174 |
| 40-49 years | 5,187 |
| 30-39 years | 6,144 |
| 20-29 years | 5,320 |
| 10-19 years | 4,605 |
| 0-9 years | 4,422 |
| Urbanization (E 2023) | |
|---|---|
| Highly urbanized | 29,570 |
| Strongly urbanized | 8,070 |
| Moderately urbanized | 2,410 |
| Lowly urbanized | 310 |
| Rural | 2,350 |
| Citizenhip (E 2023) | |
|---|---|
| Netherlands | 38,661 |
| European Union | 2,263 |
| Europe (Rest) | 374 |
| Other country | 1,413 |
| Birth Country (E 2023) | |
|---|---|
| Netherlands | 35,444 |
| Other country | 7,267 |
Comprises:
- Beverwijk Centrum municipal district
- Beverwijk Noordwestelijk tuinbouwgebied municipal district
- Broekpolder (Beverwijk) municipal district
- De Pijp en Wijkerbroek municipal district
- Kuenenkwartier municipal district
- Meerestein municipal district
- Oosterwijk en Zwaansmeer municipal district
- Oranjebuurt municipal district
- Vondelkwartier (Beverwijk) municipal district
- Warande municipal district
- Wijk aan Zee municipal district