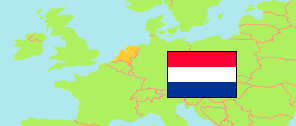
Utrecht
Province in Netherlands
Contents: Subdivision
The population development in Utrecht as well as related information and services (Wikipedia, Google, images).
| Name | Status | Population Census 2001-01-01 | Population Estimate 2008-01-01 | Population Estimate 2011-01-01 | Population Estimate 2018-01-01 | Population Estimate 2024-01-01 | |
|---|---|---|---|---|---|---|---|
| Utrecht | Province | 1,143,653 | 1,235,363 | 1,262,828 | 1,330,518 | 1,400,187 | |
| Amersfoort | Municipality | 128,023 | 141,211 | 146,592 | 155,226 | 161,825 | → |
| Baarn | Municipality | 24,526 | 24,406 | 24,379 | 24,630 | 25,062 | → |
| Bunnik | Municipality | 13,768 | 14,258 | 14,437 | 15,214 | 16,116 | → |
| Bunschoten | Municipality | 19,259 | 19,611 | 20,111 | 21,266 | 22,620 | → |
| De Bilt | Municipality | 42,050 | 41,998 | 42,049 | 42,846 | 43,709 | → |
| De Ronde Venen | Municipality | 42,712 | 43,257 | 43,004 | 43,620 | 45,812 | → |
| Eemnes | Municipality | 8,660 | 8,964 | 8,845 | 9,112 | 9,757 | → |
| Houten | Municipality | 35,976 | 46,475 | 47,935 | 49,579 | 50,855 | → |
| IJsselstein | Municipality | 30,922 | 34,059 | 34,348 | 34,302 | 33,424 | → |
| Leusden | Municipality | 28,833 | 28,540 | 28,609 | 29,755 | 31,669 | → |
| Lopik | Municipality | 13,513 | 14,047 | 14,121 | 14,395 | 14,723 | → |
| Montfoort | Municipality | 13,283 | 13,493 | 13,500 | 13,879 | 13,860 | → |
| Nieuwegein | Municipality | 62,343 | 61,087 | 60,947 | 62,426 | 65,974 | → |
| Oudewater | Municipality | 9,740 | 9,917 | 9,815 | 10,180 | 10,220 | → |
| Renswoude | Municipality | 4,055 | 4,482 | 4,752 | 5,175 | 5,755 | → |
| Rhenen | Municipality | 17,344 | 18,779 | 18,951 | 19,816 | 20,238 | → |
| Soest | Municipality | 44,621 | 45,560 | 45,611 | 46,089 | 47,685 | → |
| Stichtse Vecht | Municipality | 62,942 | 62,315 | 63,050 | 64,513 | 65,893 | → |
| Utrecht | Municipality | 256,393 | 294,737 | 311,367 | 347,483 | 374,411 | → |
| Utrechtse Heuvelrug | Municipality | 48,887 | 48,979 | 48,726 | 49,314 | 50,553 | → |
| Veenendaal | Municipality | 60,391 | 61,769 | 62,267 | 64,918 | 69,437 | → |
| Vijfheerenlanden (incl. Leerdam, Vianen, Zederik) | Municipality | 53,747 | 53,650 | 53,717 | 55,001 | 61,650 | → |
| Wijk bij Duurstede | Municipality | 23,154 | 23,306 | 23,115 | 23,678 | 23,953 | → |
| Woerden | Municipality | 46,910 | 48,383 | 49,748 | 51,758 | 53,730 | → |
| Woudenberg | Municipality | 11,025 | 11,592 | 12,008 | 13,021 | 14,633 | → |
| Zeist | Municipality | 59,836 | 60,488 | 60,824 | 63,322 | 66,623 | → |
| Nederland [Netherlands] | Country | 15,985,538 | 16,405,399 | 16,655,799 | 17,181,084 | 17,947,684 |
Source: Statistics Netherlands.
Explanation: Provinces and municipalities in the boundaries of 1 January 2024. 2024 population figures are preliminary.
Further information about the population structure:
| Gender (E 2023) | |
|---|---|
| Males | 682,812 |
| Females | 704,831 |
| Age Groups (E 2023) | |
|---|---|
| 0-17 years | 279,620 |
| 18-64 years | 860,742 |
| 65+ years | 247,281 |
| Age Distribution (E 2023) | |
|---|---|
| 90+ years | 9,595 |
| 80-89 years | 50,196 |
| 70-79 years | 116,158 |
| 60-69 years | 155,312 |
| 50-59 years | 190,589 |
| 40-49 years | 170,717 |
| 30-39 years | 191,532 |
| 20-29 years | 189,721 |
| 10-19 years | 162,181 |
| 0-9 years | 151,642 |
| Urbanization (E 2023) | |
|---|---|
| Highly urbanized | 363,570 |
| Strongly urbanized | 445,550 |
| Moderately urbanized | 243,720 |
| Lowly urbanized | 207,170 |
| Rural | 127,630 |
| Citizenhip (E 2023) | |
|---|---|
| Netherlands | 1,297,458 |
| European Union | 35,220 |
| Europe (Rest) | 11,511 |
| Other country | 43,454 |
| Birth Country (E 2023) | |
|---|---|
| Netherlands | 1,192,091 |
| Other country | 195,552 |