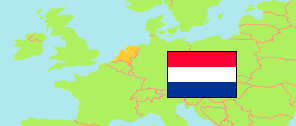
Friesland
Province in Netherlands
Contents: Subdivision
The population development in Friesland as well as related information and services (Wikipedia, Google, images).
| Name | Status | Population Census 2001-01-01 | Population Estimate 2008-01-01 | Population Estimate 2011-01-01 | Population Estimate 2018-01-01 | Population Estimate 2024-01-01 | |
|---|---|---|---|---|---|---|---|
| Friesland (Fryslân) | Province | 630,530 | 643,189 | 647,282 | 647,268 | 661,956 | |
| Achtkarspelen | Municipality | 28,013 | 28,088 | 28,123 | 27,935 | 28,226 | → |
| Ameland | Municipality | 3,545 | 3,456 | 3,503 | 3,654 | 3,832 | → |
| Dantumadiel (Dantumadeel) | Municipality | 19,843 | 19,399 | 19,310 | 18,904 | 19,135 | → |
| De Fryske Marren (incl. Skarsterlân, Lemsterland, Gaasterlân-Sleat) | Municipality | 50,750 | 51,550 | 52,050 | 51,742 | 51,928 | → |
| Harlingen | Municipality | 15,444 | 15,567 | 15,878 | 15,783 | 16,212 | → |
| Heerenveen | Municipality | ... | 49,000 | 49,400 | 50,192 | 51,794 | → |
| Leeuwarden (incl. Leeuwarderadeel) | Municipality | ... | 117,583 | 119,502 | 122,415 | 128,857 | → |
| Noardeast-Fryslân (incl. Dongeradeel, Ferwerderadeel, Kollumerland) | Municipality | 46,736 | 46,644 | 46,086 | 45,287 | 45,870 | → |
| Ooststellingwerf | Municipality | 26,238 | 26,398 | 26,004 | 25,459 | 25,825 | → |
| Opsterland | Municipality | 28,833 | 29,703 | 29,991 | 29,753 | 30,056 | → |
| Schiermonnikoog | Municipality | 1,017 | 951 | 957 | 932 | 971 | → |
| Smallingerland | Municipality | 53,010 | 54,962 | 55,436 | 55,889 | 56,654 | → |
| Súdwest-Fryslân | Municipality | ... | 88,980 | 89,700 | 89,594 | 90,435 | → |
| Terschelling | Municipality | 4,768 | 4,705 | 4,721 | 4,906 | 4,899 | → |
| Tytsjerksteradiel (Tietjerksteradeel) | Municipality | 31,049 | 32,243 | 32,178 | 31,870 | 32,601 | → |
| Vlieland | Municipality | 1,215 | 1,124 | 1,151 | 1,132 | 1,258 | → |
| Waadhoeke | Municipality | 46,712 | 47,185 | 47,431 | 46,101 | 46,910 | → |
| Weststellingwerf | Municipality | 25,246 | 25,674 | 25,846 | 25,720 | 26,493 | → |
| Nederland [Netherlands] | Country | 15,985,538 | 16,405,399 | 16,655,799 | 17,181,084 | 17,947,684 |
Source: Statistics Netherlands.
Explanation: Provinces and municipalities in the boundaries of 1 January 2024. 2024 population figures are preliminary.
Further information about the population structure:
| Gender (E 2023) | |
|---|---|
| Males | 330,889 |
| Females | 328,662 |
| Age Groups (E 2023) | |
|---|---|
| 0-17 years | 123,551 |
| 18-64 years | 385,992 |
| 65+ years | 150,008 |
| Age Distribution (E 2023) | |
|---|---|
| 90+ years | 5,433 |
| 80-89 years | 31,205 |
| 70-79 years | 71,019 |
| 60-69 years | 88,639 |
| 50-59 years | 97,941 |
| 40-49 years | 74,801 |
| 30-39 years | 73,355 |
| 20-29 years | 76,887 |
| 10-19 years | 76,775 |
| 0-9 years | 63,496 |
| Urbanization (E 2023) | |
|---|---|
| Highly urbanized | 55,460 |
| Strongly urbanized | 75,560 |
| Moderately urbanized | 87,340 |
| Lowly urbanized | 148,770 |
| Rural | 292,420 |
| Citizenhip (E 2023) | |
|---|---|
| Netherlands | 637,883 |
| European Union | 7,946 |
| Europe (Rest) | 3,912 |
| Other country | 9,810 |
| Birth Country (E 2023) | |
|---|---|
| Netherlands | 613,703 |
| Other country | 45,848 |