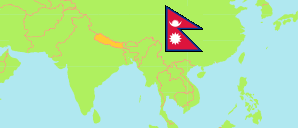
Kawilasi
Municipality in Nepal
Contents: Population
The population development of Kawilasi as well as related information and services (Wikipedia, Google, images).
| Name | Status | Transcription | Native | Population Census 2001-05-28 | Population Census 2011-06-22 | Population Census 2021-11-25 | |
|---|---|---|---|---|---|---|---|
| Kawilasi | Municipality | Kavilāsī | कविलासी नगरपालिका | 34,495 | 42,336 | 44,204 | |
| Nepal | Federal Republic | Nēpāla | नेपाल | 23,151,423 | 26,494,504 | 29,164,578 |
Source: Central Bureau of Statistics Nepal (web).
Explanation: The local units became operational in May 2017. The 2021 population of local units exclude institional population.
Further information about the population structure:
| Gender (C 2021) | |
|---|---|
| Males | 22,452 |
| Females | 21,752 |
| Age Groups (C 2021) | |
|---|---|
| 0-14 years | 15,098 |
| 15-64 years | 26,406 |
| 65+ years | 2,700 |
| Age Distribution (C 2021) | |
|---|---|
| 90+ years | 49 |
| 80-89 years | 212 |
| 70-79 years | 1,351 |
| 60-69 years | 2,363 |
| 50-59 years | 3,241 |
| 40-49 years | 4,136 |
| 30-39 years | 5,500 |
| 20-29 years | 7,575 |
| 10-19 years | 9,998 |
| 0-9 years | 9,779 |
| Citizenhip (C 2021) | |
|---|---|
| Nepal | 44,021 |
| India | 176 |
| Other Citizenship | 4 |
| Place of Birth (C 2021) | |
|---|---|
| Same local unit | 37,435 |
| Other local unit in same district | 5,333 |
| Other district | 650 |
| Other country | 783 |
| Literacy (A5+) (C 2021) | |
|---|---|
| Yes | 21,076 |
| Only reading | 62 |
| No | 18,470 |