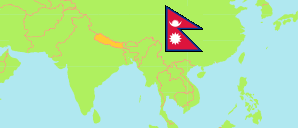
Lamjung
District in Nepal
Contents: Subdivision
The population development in Lamjung as well as related information and services (Wikipedia, Google, images).
| Name | Status | Transcription | Native | Population Census 2001-05-28 | Population Census 2011-06-22 | Population Census 2021-11-25 | |
|---|---|---|---|---|---|---|---|
| Lamjung | District | Lamajuṅa | लमजुङ जिल्ला | 177,149 | 167,724 | 155,852 | |
| Besishahar | Municipality | Bēsīsahara | बेसीसहर नगरपालिका | ... | 40,599 | 38,232 | → |
| Dordi | Rural Municipality | Dōrdī | दोर्दी गाउँपालिका | ... | 18,252 | 16,050 | → |
| Dudhpokhari | Rural Municipality | Dūdhapōkharī | दूधपोखरी गाउँपालिका | 13,814 | 10,975 | 8,592 | → |
| Kwholasothar | Rural Municipality | Kvhōlāsōthāra | क्व्होलासोथार गाउँपालिका | ... | 10,067 | 7,960 | → |
| Madhyanepal | Municipality | Madhyanēpāla | मध्यनेपाल नगरपालिका | 25,675 | 23,474 | 21,971 | → |
| Marsyangdi | Rural Municipality | Marsyāṅadī | मर्स्याङदी गाउँपालिका | 20,475 | 18,811 | 17,080 | → |
| Rainas | Municipality | Rāīnāsa | राईनास नगरपालिका | 20,161 | 18,527 | 17,402 | → |
| Sundarbazar | Municipality | Sundarabajāra | सुन्दरबजार नगरपालिका | 26,890 | 27,019 | 27,043 | → |
| Nepal | Federal Republic | Nēpāla | नेपाल | 23,151,423 | 26,494,504 | 29,164,578 |
Source: Central Bureau of Statistics Nepal (web).
Explanation: The local units became operational in May 2017. The 2021 population of local units exclude institional population.
Further information about the population structure:
| Gender (C 2021) | |
|---|---|
| Males | 74,077 |
| Females | 81,775 |
| Age Groups (C 2021) | |
|---|---|
| 0-14 years | 34,426 |
| 15-64 years | 103,296 |
| 65+ years | 18,130 |
| Age Distribution (C 2021) | |
|---|---|
| 90+ years | 519 |
| 80-89 years | 2,773 |
| 70-79 years | 8,318 |
| 60-69 years | 14,503 |
| 50-59 years | 18,337 |
| 40-49 years | 17,166 |
| 30-39 years | 21,036 |
| 20-29 years | 25,070 |
| 10-19 years | 27,194 |
| 0-9 years | 20,936 |
| Citizenhip (C 2021) | |
|---|---|
| Nepal | 155,447 |
| India | 391 |
| Other country | 14 |
| Place of Birth (C 2021) | |
|---|---|
| Same local unit | 115,429 |
| Other local unit in same district | 20,902 |
| Other district | 18,146 |
| Other country | 1,204 |
| Literacy (A5+) (C 2021) | |
|---|---|
| Yes | 113,561 |
| Only reading | 1,252 |
| No | 31,632 |