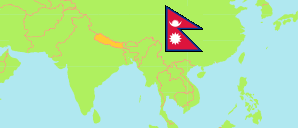
Mahottari
District in Nepal
Contents: Subdivision
The population development in Mahottari as well as related information and services (Wikipedia, Google, images).
| Name | Status | Transcription | Native | Population Census 2001-05-28 | Population Census 2011-06-22 | Population Census 2021-11-25 | |
|---|---|---|---|---|---|---|---|
| Mahottari | District | Mahōttarī | महोत्तरी जिल्ला | 553,481 | 627,580 | 706,994 | |
| Aurahi | Municipality | Aurahī | औरही नगरपालिका | ... | 31,851 | 37,361 | → |
| Balwa | Municipality | Balavā | बलवा नगरपालिका | 38,863 | 42,368 | 49,473 | → |
| Bardibas | Municipality | Bardibāsa | बर्दिबास नगरपालिका | 57,008 | 64,721 | 74,361 | → |
| Bhangaha | Municipality | Bhãgāhā | भँगाहा नगरपालिका | 42,612 | 46,832 | 55,354 | → |
| Ekdara | Rural Municipality | Ēkaḍārā | एकडारा गाउँपालिका | 25,195 | 29,315 | 31,770 | → |
| Gaushala | Municipality | Gauśālā | गौशाला नगरपालिका | 56,182 | 66,715 | 72,481 | → |
| Jaleshwar | Municipality | Jalēśvara | जलेश्वर नगरपालिका | 51,838 | 59,261 | 63,802 | → |
| Loharpatti | Municipality | Lōhārapaṭṭī | लोहारपट्टी नगरपालिका | 36,884 | 39,883 | 45,773 | → |
| Mahottari | Rural Municipality | Mahōttarī | महोत्तरी गाउँपालिका | 26,343 | 27,430 | 28,807 | → |
| Manra Shisawa | Municipality | Manarā Śisavā | मनरा शिसवा नगरपालिका | 44,263 | 49,692 | 52,191 | → |
| Matihani | Municipality | Maṭihānī | मटिहानी नगरपालिका | 26,542 | 31,026 | 36,136 | → |
| Pipra | Rural Municipality | Piparā | पिपरा गाउँपालिका | 32,874 | 35,524 | 40,535 | → |
| Ramgopalpur | Municipality | Rāmagōpālapura | रामगोपालपुर नगरपालिका | ... | 30,412 | 36,201 | → |
| Samsi | Rural Municipality | Sāmsī | साम्सी गाउँपालिका | 29,451 | 33,803 | 38,585 | → |
| Sonma | Rural Municipality | Sōnamā | सोनमा गाउँपालिका | 31,925 | 38,747 | 43,082 | → |
| Nepal | Federal Republic | Nēpāla | नेपाल | 23,151,423 | 26,494,504 | 29,164,578 |
Source: Central Bureau of Statistics Nepal (web).
Explanation: The local units became operational in May 2017. The 2021 population of local units exclude institional population.
Further information about the population structure:
| Gender (C 2021) | |
|---|---|
| Males | 349,159 |
| Females | 357,835 |
| Age Groups (C 2021) | |
|---|---|
| 0-14 years | 240,516 |
| 15-64 years | 421,133 |
| 65+ years | 45,345 |
| Age Distribution (C 2021) | |
|---|---|
| 90+ years | 934 |
| 80-89 years | 3,406 |
| 70-79 years | 21,669 |
| 60-69 years | 40,469 |
| 50-59 years | 50,909 |
| 40-49 years | 67,055 |
| 30-39 years | 90,675 |
| 20-29 years | 117,939 |
| 10-19 years | 155,498 |
| 0-9 years | 158,440 |
| Citizenhip (C 2021) | |
|---|---|
| Nepal | 703,799 |
| India | 3,172 |
| Other Citizenship | 23 |
| Place of Birth (C 2021) | |
|---|---|
| Same local unit | 549,352 |
| Other local unit in same district | 70,359 |
| Other district | 57,664 |
| Other country | 29,575 |
| Literacy (A5+) (C 2021) | |
|---|---|
| Yes | 377,568 |
| Only reading | 1,868 |
| No | 252,123 |