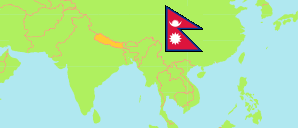
Morang
District in Nepal
Contents: Subdivision
The population development in Morang as well as related information and services (Wikipedia, Google, images).
| Name | Status | Transcription | Native | Population Census 2001-05-28 | Population Census 2011-06-22 | Population Census 2021-11-25 | |
|---|---|---|---|---|---|---|---|
| Morang | District | Mōraṅa | मोरङ जिल्ला | 843,220 | 965,370 | 1,148,156 | |
| Belbari | Municipality | Bēlavārī | बेलवारी नगरपालिका | 58,397 | 65,974 | 81,771 | → |
| Biratnagar | Metropolis | Virāṭanagara | विराटनगर महानगरपालिका | ... | 218,526 | 243,927 | → |
| Budhiganga | Rural Municipality | Buḍhīgaṅgā | बुढीगंगा गाउँपालिका | 34,193 | 41,971 | 51,497 | → |
| Dhanpalthan | Rural Municipality | Dhanapālathāna | धनपालथान गाउँपालिका | 35,217 | 39,470 | 45,348 | → |
| Gramthan | Rural Municipality | Grāmathāna | ग्रामथान गाउँपालिका | 31,374 | 32,717 | 36,024 | → |
| Jahada | Rural Municipality | Jahadā | जहदा गाउँपालिका | ... | 41,819 | 47,639 | → |
| Kanepokhari | Rural Municipality | Kānēpōkharī | कानेपोखरी गाउँपालिका | 37,359 | 38,041 | 43,193 | → |
| Katahari | Rural Municipality | Kaṭaharī | कटहरी गाउँपालिका | 32,539 | 39,775 | 48,510 | → |
| Kerabari | Rural Municipality | Kērāvārī | केरावारी गाउँपालिका | ... | 30,918 | 34,504 | → |
| Letang | Municipality | Lēṭāṅa | लेटाङ नगरपालिका | ... | 32,782 | 38,152 | → |
| Miklajung | Rural Municipality | Miklājuṅa | मिक्लाजुङ गाउँपालिका | ... | 28,709 | 33,167 | → |
| Pathari Shanishchare | Municipality | Patharī Śaniścarē | पथरी शनिश्चरे नगरपालिका | 56,012 | 61,132 | 72,451 | → |
| Rangeli | Municipality | Raṅgēlī | रंगेली नगरपालिका | 51,186 | 51,357 | 57,494 | → |
| Ratuwamai | Municipality | Ratuvāmāī | रतुवामाई नगरपालिका | ... | 55,418 | 61,139 | → |
| Sunawarshi | Municipality | Sunavarṣi | सुनवर्षि नगरपालिका | ... | 51,444 | 56,034 | → |
| Sundarharaicha | Municipality | Sundaraharaicā | सुन्दरहरैचा नगरपालिका | 62,221 | 80,621 | 120,213 | → |
| Urlabari | Municipality | Urlāvārī | उर्लावारी नगरपालिका | ... | 54,696 | 70,908 | → |
| Nepal | Federal Republic | Nēpāla | नेपाल | 23,151,423 | 26,494,504 | 29,164,578 |
Source: Central Bureau of Statistics Nepal (web).
Explanation: The local units became operational in May 2017. The 2021 population of local units exclude institional population.
Further information about the population structure:
| Gender (C 2021) | |
|---|---|
| Males | 557,512 |
| Females | 590,644 |
| Age Groups (C 2021) | |
|---|---|
| 0-14 years | 295,185 |
| 15-64 years | 770,552 |
| 65+ years | 82,419 |
| Age Distribution (C 2021) | |
|---|---|
| 90+ years | 1,986 |
| 80-89 years | 9,775 |
| 70-79 years | 37,607 |
| 60-69 years | 74,341 |
| 50-59 years | 106,997 |
| 40-49 years | 138,441 |
| 30-39 years | 172,901 |
| 20-29 years | 201,855 |
| 10-19 years | 212,738 |
| 0-9 years | 191,515 |
| Citizenhip (C 2021) | |
|---|---|
| Nepal | 1,143,069 |
| India | 5,035 |
| Other Citizenship | 46 |
| Place of Birth (C 2021) | |
|---|---|
| Same local unit | 716,592 |
| Other local unit in same district | 86,550 |
| Other district | 297,584 |
| Other country | 47,218 |
| Literacy (A5+) (C 2021) | |
|---|---|
| Yes | 833,733 |
| Only reading | 2,143 |
| No | 224,566 |