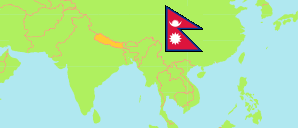
Syangja
District in Nepal
Contents: Population
The population development of Syangja as well as related information and services (Wikipedia, Google, images).
| Name | Status | Transcription | Native | Population Census 1981-06-22 | Population Census 1991-06-22 | Population Census 2001-05-28 | Population Census 2011-06-22 | Population Census 2021-11-25 | |
|---|---|---|---|---|---|---|---|---|---|
| Syangja | District | Syāṅjā | स्याङ्जा जिल्ला | 271,824 | 293,526 | 317,320 | 289,148 | 253,024 | |
| Nepal | Federal Republic | Nēpāla | नेपाल | 15,022,839 | 18,491,097 | 23,151,423 | 26,494,504 | 29,164,578 |
Source: Central Bureau of Statistics Nepal (web).
Further information about the population structure:
| Gender (C 2021) | |
|---|---|
| Males | 116,678 |
| Females | 136,346 |
| Age Groups (C 2021) | |
|---|---|
| 0-14 years | 57,230 |
| 15-64 years | 166,860 |
| 65+ years | 28,934 |
| Age Distribution (C 2021) | |
|---|---|
| 90+ years | 767 |
| 80-89 years | 4,156 |
| 70-79 years | 13,471 |
| 60-69 years | 22,960 |
| 50-59 years | 27,884 |
| 40-49 years | 28,849 |
| 30-39 years | 33,232 |
| 20-29 years | 40,907 |
| 10-19 years | 44,563 |
| 0-9 years | 36,235 |
| Citizenhip (C 2021) | |
|---|---|
| Nepal | 252,649 |
| India | 368 |
| Other Citizenship | 7 |
| Place of Birth (C 2021) | |
|---|---|
| Same local unit | 191,104 |
| Other local unit in same district | 34,609 |
| Other district | 24,412 |
| Other country | 2,707 |
| Literacy (A5+) (C 2021) | |
|---|---|
| Yes | 193,051 |
| Only reading | 1,481 |
| No | 41,615 |