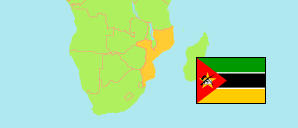
Cabo Delgado
Province in Mozambique
Contents: Subdivision
The population development in Cabo Delgado as well as related information and services (Wikipedia, Google, images).
| Name | Status | Population Census 1997-08-01 | Population Census 2007-09-16 | Population Census 2017-08-01 | |
|---|---|---|---|---|---|
| Cabo Delgado | Province | 1,287,814 | 1,606,568 | 2,267,715 | |
| Ancuabe | District | 87,243 | 107,238 | 159,340 | → |
| Balama | District | 98,653 | 124,100 | 175,733 | → |
| Chiúre | District | 185,618 | 217,487 | 299,235 | → |
| Ibo | District | 7,061 | 9,344 | 12,205 | → |
| Macomia | District | 69,973 | 79,825 | 114,345 | → |
| Mecúfi | District | 35,644 | 43,285 | 61,531 | → |
| Meluco | District | 23,912 | 24,637 | 36,700 | → |
| Metuge | District | 42,935 | 63,100 | 86,866 | → |
| Mocímboa da Praia | District | 75,001 | 90,421 | 127,705 | → |
| Montepuez | District | 149,181 | 193,602 | 272,069 | → |
| Mueda | District | 98,654 | 113,742 | 170,347 | → |
| Muidumbe | District | 63,820 | 72,840 | 98,864 | → |
| Namuno | District | 138,229 | 179,408 | 245,248 | → |
| Nangade | District | 50,483 | 62,734 | 89,714 | → |
| Palma | District | 42,182 | 48,318 | 67,025 | → |
| Pemba | City | 84,897 | 138,716 | 200,529 | → |
| Quissanga | District | 34,328 | 37,771 | 50,259 | → |
| Moçambique [Mozambique] | Republic | 15,278,334 | 20,252,223 | 26,899,105 |
Source: Instituto Nacional de Estatistica Moçambique (web).
Explanation: The tabulated population figures are not adjusted for underenumeration; the average omission rate is estimated as 3.7% in 2017. In some cases population changes are also the result of boundary changes. Area figures of districts and cities are derived from geospatial data.
Further information about the population structure:
| Gender (C 2017) | |
|---|---|
| Males | 1,098,070 |
| Females | 1,169,645 |
| Age Groups (C 2017) | |
|---|---|
| 0-14 years | 1,060,222 |
| 15-64 years | 1,119,337 |
| 65+ years | 88,156 |
| Age Distribution (C 2017) | |
|---|---|
| 80+ years | 17,155 |
| 70-79 years | 38,122 |
| 60-69 years | 71,490 |
| 50-59 years | 99,879 |
| 40-49 years | 174,920 |
| 30-39 years | 246,157 |
| 20-29 years | 342,514 |
| 10-19 years | 484,044 |
| 0-9 years | 793,434 |