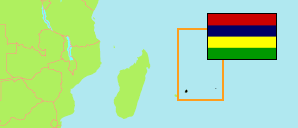
Surinam
Village Council Area in Mauritius
Contents: Population
The population development in Surinam as well as related information and services (Wikipedia, Google, images).
| Name | Status | Population Census 2000-07-02 | Population Census 2011-07-03 | Population Estimate 2014-07-01 | Population Estimate 2020-07-01 | |
|---|---|---|---|---|---|---|
| Surinam | Village Council Area | 10,045 | 10,507 | 10,631 | 10,564 | |
| Mauritius | Island | 1,143,069 | 1,196,383 | 1,219,265 | 1,221,921 |
Source: Central Statistical Office of Mauritius (web).
Explanation: Area figures are computed by using geospatial data.
Further information about the population structure:
| Gender (C 2011) | |
|---|---|
| Males | 5,330 |
| Females | 5,177 |
| Age Groups (C 2011) | |
|---|---|
| 0-14 years | 2,174 |
| 15-64 years | 7,557 |
| 65+ years | 776 |
| Age Distribution (C 2011) | |
|---|---|
| 0-9 years | 1,388 |
| 10-19 years | 1,687 |
| 20-29 years | 1,650 |
| 30-39 years | 1,515 |
| 40-49 years | 1,693 |
| 50-59 years | 1,312 |
| 60+ years | 1,262 |
| Language at Home (C 2011) | |
|---|---|
| Bhojpuri | 97 |
| Creole | 9,977 |
| English | 22 |
| French | 85 |
| Hindi | 163 |
| Other language | 163 |
| Religion (C 2011) | |
|---|---|
| Roman Catholic | 2,115 |
| Other Christian | 487 |
| Hindu | 6,498 |
| Muslim | 1,371 |
| Other/no religion | 36 |