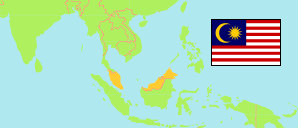
Pasir Mas
District in Malaysia
Contents: Population
The population development of Pasir Mas as well as related information and services (Wikipedia, Google, images).
| Name | Status | Population Census 2000-07-05 | Population Census 2010-07-06 | Population Census 2020-07-07 | Population Estimate 2023-07-01 | |
|---|---|---|---|---|---|---|
| Pasir Mas | District | 165,126 | 189,292 | 230,424 | 237,200 | |
| Malaysia | Federation | 23,274,690 | 28,334,135 | 32,447,385 | 33,379,500 |
Source: Department of Statistics Malaysia.
Further information about the population structure:
| Gender (E 2023) | |
|---|---|
| Males | 120,100 |
| Females | 117,100 |
| Age Groups (E 2023) | |
|---|---|
| 0-14 years | 71,500 |
| 15-64 years | 147,900 |
| 65+ years | 18,000 |
| Age Distribution (E 2023) | |
|---|---|
| 80+ years | 2,100 |
| 70-79 years | 7,900 |
| 60-69 years | 18,000 |
| 50-59 years | 20,600 |
| 40-49 years | 22,400 |
| 30-39 years | 30,900 |
| 20-29 years | 40,400 |
| 10-19 years | 54,900 |
| 0-9 years | 40,200 |
| Urbanization (C 2020) | |
|---|---|
| Rural | 180,087 |
| Urban | 50,337 |
| Religion (C 2020) | |
|---|---|
| Muslim | 225,777 |
| Christian | 231 |
| Buddhist | 3,849 |
| Hindu | 5 |
| Other religion | 6 |
| No religion | 3 |