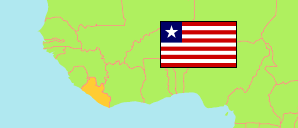
Counties
The population of the counties of Liberia by census years.
| Name | Abbr. | Capital | Area A (km²) | Population Census (C) 1984-02-01 | Population Census (Cf) 2008-03-21 | Population Census (Cf) 2022-11-11 | |||
|---|---|---|---|---|---|---|---|---|---|
| Liberia | LBR | Monrovia | 97,036 | 2,101,628 | 3,476,608 | 5,250,187 | |||
| Bomi | BM | Tubmanburg | 1,942 | 66,420 | 84,119 | 133,705 | 194200 | ||
| Bong | BG | Gbarnga | 8,769 | 255,813 | 333,481 | 467,561 | 876900 | ||
| Gbarpolu | GP | Bopolu | 9,685 | 48,399 | 83,388 | 95,995 | 968500 | ||
| Grand Bassa | GB | Buchanan | 7,932 | 159,648 | 221,693 | 293,689 | 793200 | ||
| Grand Cape Mount | CM | Robertsport | 5,160 | 79,322 | 127,076 | 178,867 | 516000 | ||
| Grand Gedeh | GG | Zwedru | 10,480 | 63,028 | 125,258 | 216,692 | 1048000 | ||
| Grand Kru (Kru Coast & Sasstown) | GK | Barclayville | 3,894 | 62,791 | 57,913 | 109,342 | 389400 | ||
| Lofa | LO | Voinjama | 9,978 | 199,242 | 276,863 | 367,376 | 997800 | ||
| Margibi (Gibi & Marshall) | MG | Kakata | 2,615 | 151,792 | 209,923 | 304,946 | 261500 | ||
| Maryland | MY | Harper | 2,296 | 69,267 | 135,938 | 172,587 | 229600 | ||
| Montserrado | MO | Bensonville | 1,908 | 491,078 | 1,118,241 | 1,920,965 | 190800 | ||
| Nimba | NI | Sanniquellie | 11,546 | 313,050 | 462,026 | 621,841 | 1154600 | ||
| Rivercess | RI | Cesstos City | 5,592 | 37,849 | 71,509 | 90,819 | 559200 | ||
| River Gee | RG | Fish Town | 5,110 | 39,782 | 66,789 | 124,653 | 511000 | ||
| Sinoe | SI | Greenville | 10,133 | 64,147 | 102,391 | 151,149 | 1013300 |
- Liberia Institute of Statistics & Geo-Information Services.
Major Cities
| Name | Adm. | Population Census (Cf) 2022-11-11 | |
|---|---|---|---|
| 1 | Monrovia | MO | 1,761,032 |
Contents: Cities, Towns & Urban Areas
The population of all Liberian cities, towns and urban areas with more than 5,000 inhabitants according to census results.
| Name | Adm. | Population Census (C) 1974-02-01 | Population Census (Cf) 2008-03-21 | Area | |
|---|---|---|---|---|---|
| Barclayville | GK | ... | 3,108 | 0 | |
| Bensonville | MO | ... | 520 | 0 | |
| Bopolu | GP | ... | 2,912 | 0 | |
| Buchanan | GB | 23,999 | 50,245 | 0 | |
| Cesstos City (River Cess) | RI | 2,041 | 2,389 | 0 | |
| Fish Town | RG | ... | 3,566 | 0 | |
| Foya | LO | ... | 20,569 | 0 | |
| Ganta | NI | 6,356 | 42,077 | 0 | |
| Gbarnga | BG | 7,220 | 56,986 | 0 | |
| Greenville | SI | 8,462 | 13,370 | 0 | |
| Harbel | MG | 11,445 | 25,309 | 0 | |
| Harper | MY | 10,627 | 23,517 | 0 | |
| Kakata | MG | 9,992 | 34,608 | 0 | |
| Karnplay (Kahnple) | NI | ... | 5,585 | 0 | |
| Monrovia | MO | 204,210 | 1,021,762 | 0 | |
| Pleebo (Plibo) | MY | 6,315 | 23,464 | 0 | |
| Robertsport | CM | 2,562 | 3,515 | 0 | |
| Sacleapea (Sagleipie) | NI | ... | 13,790 | 0 | |
| Sanniquellie | NI | 6,690 | 11,854 | 0 | |
| Tubmanburg | BM | 14,089 | 14,576 | 0 | |
| Voinjama | LO | 6,343 | 15,269 | 0 | |
| Zorzor | LO | 4,752 | 5,577 | 0 | |
| Zwedru | GG | 6,094 | 25,349 | 0 |
- (2008) Liberia Institute of Statistics & Geo-Information Services.
Population Structure
Further information about the population structure.
| Gender (C 2022) | |
|---|---|
| Males | 2,644,027 |
| Females | 2,606,160 |
| Age Groups (C 2022) | |
|---|---|
| 0-14 years | 1,797,178 |
| 15-64 years | 3,305,412 |
| 65+ years | 147,597 |
| Age Distribution (C 2022) | |
|---|---|
| 90+ years | 18,247 |
| 80-89 years | 19,631 |
| 70-79 years | 60,934 |
| 60-69 years | 137,832 |
| 50-59 years | 263,823 |
| 40-49 years | 497,817 |
| 30-39 years | 775,792 |
| 20-29 years | 1,040,470 |
| 10-19 years | 1,271,085 |
| 0-9 years | 1,164,556 |
| Urbanization (C 2022) | |
|---|---|
| Rural | 2,388,033 |
| Urban | 2,862,154 |
| Literacy (A10+) (C 2022) | |
|---|---|
| Yes | 2,447,612 |
| No | 1,638,019 |
