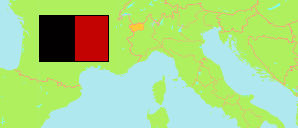
Region
The population development of the Aosta Valley according to census results and latest official estimates.
| Name | Abbr. | Status | Capital | Area A (km²) | Population Census (C) 1981-10-25 | Population Census (C) 1991-10-20 | Population Census (C) 2001-10-21 | Population Census (C) 2011-10-09 | Population Evaluation (R) 2022-01-01 | Population Evaluation (Rp) 2024-01-01 | ||
|---|---|---|---|---|---|---|---|---|---|---|---|---|
| Valle d'Aosta (Vallée d'Aoste) [Aosta Valley] | VDA | AReg | Aosta | 3,261 | 112,353 | 115,938 | 119,548 | 126,806 | 123,360 | 123,018 | 326100 | → |
| Italy | ITA | Rep | Roma | 302,068 | 56,556,911 | 56,778,031 | 56,995,744 | 59,433,744 | 59,030,133 | 58,989,749 | → |
- Population figures for 2022 and later are result of a sampling survey combined with an evaluation of registers.
- Istituto Nazionale di Statistica Italia.
Contents: Cities & Communes
The population of all cities and communes in the Aosta Valley with more than 3,000 inhabitants according to census results and latest official estimates.
| Name | Population Census (C) 1981-10-25 | Population Census (C) 1991-10-20 | Population Census (C) 2001-10-21 | Population Census (C) 2011-10-09 | Population Evaluation (R) 2022-01-01 | Population Evaluation (Rp) 2024-01-01 | Area | |
|---|---|---|---|---|---|---|---|---|
| Aosta | 37,194 | 36,214 | 34,062 | 34,102 | 33,223 | 33,176 | 2139 | → |
| Châtillon | 4,657 | 4,632 | 4,712 | 4,946 | 4,402 | 4,366 | 3968 | → |
| Gressan | 1,927 | 2,298 | 2,731 | 3,306 | 3,390 | 3,374 | 2530 | → |
| Nus | 2,056 | 2,259 | 2,577 | 2,943 | 2,988 | 2,953 | 5735 | → |
| Pont-Saint-Martin | 3,897 | 3,800 | 3,833 | 4,005 | 3,553 | 3,535 | 692 | → |
| Quart | 2,156 | 2,602 | 3,103 | 3,872 | 4,089 | 4,127 | 6205 | → |
| Saint-Christophe | 2,340 | 2,598 | 2,982 | 3,356 | 3,484 | 3,495 | 1474 | → |
| Saint-Pierre | 1,797 | 2,199 | 2,615 | 3,112 | 3,240 | 3,295 | 2618 | → |
| Saint-Vincent | 4,675 | 4,860 | 4,687 | 4,654 | 4,451 | 4,455 | 2057 | → |
| Sarre | 3,071 | 3,702 | 4,179 | 4,857 | 4,755 | 4,794 | 2828 | → |
- Population figures for 2022 and later are result of a sampling survey combined with an evaluation of registers.
- Istituto Nazionale di Statistica Italia.
Population Structure
Further information about the population structure.
| Gender (R 2024) | |
|---|---|
| Males | 60,399 |
| Females | 62,619 |
| Age Groups (R 2024) | |
|---|---|
| 0-17 years | 18,257 |
| 18-64 years | 73,641 |
| 65+ years | 31,120 |
| Age Distribution (R 2024) | |
|---|---|
| 90+ years | 1,814 |
| 80-89 years | 8,208 |
| 70-79 years | 13,245 |
| 60-69 years | 17,169 |
| 50-59 years | 21,092 |
| 40-49 years | 16,043 |
| 30-39 years | 12,658 |
| 20-29 years | 12,168 |
| 10-19 years | 11,930 |
| 0-9 years | 8,691 |
| Citizenship (R 2024) | |
|---|---|
| Italy | 114,355 |
| Foreign Citizenship | 8,663 |
