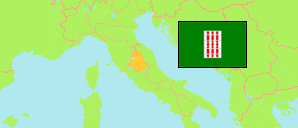
Provinces
The population of the provinces of Umbria according to census results and latest official estimates.
| Name | Abbr. | Status | Capital | Area A (km²) | Population Census (C) 1981-10-25 | Population Census (C) 1991-10-20 | Population Census (C) 2001-10-21 | Population Census (C) 2011-10-09 | Population Census (C) 2021-12-31 | Population Estimate (Ep) 2025-01-01 | ||
|---|---|---|---|---|---|---|---|---|---|---|---|---|
| Perugia | Prov | Perugia | 6,337 | 580,988 | 588,781 | 605,950 | 655,844 | 640,482 | 636,531 | 633700 | → | |
| Terni | Prov | Terni | 2,127 | 226,564 | 223,050 | 219,876 | 228,424 | 218,330 | 215,423 | 212700 | → | |
| Umbria | UMB | Reg | Perugia | 8,464 | 807,552 | 811,831 | 825,826 | 884,268 | 858,812 | 851,954 | 846400 | → |
| Italy | ITA | Rep | Roma | 302,068 | 56,556,911 | 56,778,031 | 56,995,744 | 59,433,744 | 59,030,133 | 58,934,177 | → |
- Istituto Nazionale di Statistica Italia.
Major Cities
| Name | Population Estimate (Ep) 2025-01-01 | |
|---|---|---|
| 1 | Perugia | 162,467 |
| 2 | Terni | 106,411 |
| 3 | Foligno | 55,310 |
| 4 | Città di Castello | 37,884 |
| 5 | Spoleto | 35,972 |
Contents: Cities & Communes
The population of all cities and communes in Umbria with more than 20,000 inhabitants according to census results and latest official estimates.
| Name | Population Census (C) 1981-10-25 | Population Census (C) 1991-10-20 | Population Census (C) 2001-10-21 | Population Census (C) 2011-10-09 | Population Census (C) 2021-12-31 | Population Estimate (Ep) 2025-01-01 | Area | |
|---|---|---|---|---|---|---|---|---|
| Assisi | 24,664 | 24,626 | 25,304 | 27,377 | 27,880 | 27,453 | 18719 | → |
| Bastia Umbra | 14,988 | 16,244 | 18,400 | 21,653 | 21,256 | 21,352 | 2760 | → |
| Città di Castello | 37,643 | 37,455 | 37,889 | 40,064 | 38,505 | 37,884 | 38732 | → |
| Corciano | 11,123 | 13,090 | 15,256 | 20,255 | 21,429 | 21,600 | 6372 | → |
| Foligno | 52,551 | 53,202 | 51,130 | 56,045 | 55,503 | 55,310 | 26466 | → |
| Gubbio | 31,961 | 30,792 | 31,616 | 32,432 | 30,650 | 30,297 | 52577 | → |
| Narni | 20,741 | 20,439 | 20,070 | 20,054 | 18,258 | 17,800 | 19798 | → |
| Orvieto | 22,847 | 21,419 | 20,705 | 21,064 | 19,689 | 19,199 | 28127 | → |
| Perugia | 142,348 | 144,732 | 149,125 | 162,449 | 162,362 | 162,467 | 44961 | → |
| Spoleto | 37,360 | 37,763 | 37,889 | 38,429 | 36,467 | 35,972 | 34814 | → |
| Terni | 111,564 | 108,248 | 105,018 | 109,193 | 107,165 | 106,411 | 21243 | → |
- Istituto Nazionale di Statistica Italia.
Population Structure
Further information about the population structure.
| Gender (R 2025) | |
|---|---|
| Males | 413,891 |
| Females | 438,063 |
| Age Groups (R 2025) | |
|---|---|
| 0-17 years | 118,928 |
| 18-64 years | 500,296 |
| 65+ years | 232,730 |
| Age Distribution (R 2025) | |
|---|---|
| 90+ years | 16,425 |
| 80-89 years | 62,997 |
| 70-79 years | 97,555 |
| 60-69 years | 120,989 |
| 50-59 years | 136,197 |
| 40-49 years | 111,825 |
| 30-39 years | 88,769 |
| 20-29 years | 81,786 |
| 10-19 years | 78,688 |
| 0-9 years | 56,723 |
| Citizenship (R 2025) | |
|---|---|
| Italy | 761,367 |
| Foreign Citizenship | 90,587 |
