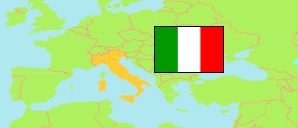
Como
Province in Italy
Contents: Population
The population development of Como as well as related information and services (Wikipedia, Google, images).
| Name | Status | Population Census 1981-10-25 | Population Census 1991-10-20 | Population Census 2001-10-21 | Population Census 2011-10-09 | Population Census 2021-12-31 | Population Estimate 2025-01-01 | |
|---|---|---|---|---|---|---|---|---|
| Como | Province | 511,425 | 522,147 | 537,500 | 586,735 | 594,941 | 598,333 | |
| Italia [Italy] | Republic | 56,556,911 | 56,778,031 | 56,995,744 | 59,433,744 | 59,030,133 | 58,934,177 |
Source: Istituto Nazionale di Statistica Italia.
Explanation: The 2025 figures are preliminary.
Further information about the population structure:
| Gender (E 2025) | |
|---|---|
| Males | 295,133 |
| Females | 303,200 |
| Age Groups (E 2025) | |
|---|---|
| 0-17 years | 89,180 |
| 18-64 years | 362,968 |
| 65+ years | 146,185 |
| Age Distribution (E 2025) | |
|---|---|
| 90+ years | 8,926 |
| 80-89 years | 37,773 |
| 70-79 years | 63,038 |
| 60-69 years | 81,081 |
| 50-59 years | 100,055 |
| 40-49 years | 80,230 |
| 30-39 years | 65,872 |
| 20-29 years | 60,354 |
| 10-19 years | 57,260 |
| 0-9 years | 43,744 |
| Citizenship (E 2025) | |
|---|---|
| Italy | 547,732 |
| Foreign Citizenship | 50,601 |