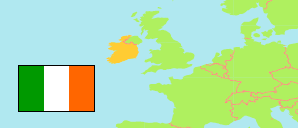
Kilkenny
County in Ireland
Contents: Population
The population development of Kilkenny as well as related information and services (Wikipedia, Google, images).
| Name | Status | Population Census 1981-04-05 | Population Census 1986-04-13 | Population Census 1991-04-21 | Population Census 1996-04-28 | Population Census 2002-04-28 | Population Census 2006-04-23 | Population Census 2011-04-10 | Population Census 2016-04-24 | Population Census 2022-04-03 | |
|---|---|---|---|---|---|---|---|---|---|---|---|
| Kilkenny | County | 70,806 | 73,186 | 73,635 | 75,336 | 80,339 | 87,558 | 95,419 | 99,232 | 104,160 | |
| Ireland (Éire) | Republic | 3,443,405 | 3,540,643 | 3,525,719 | 3,626,087 | 3,917,203 | 4,239,848 | 4,588,252 | 4,761,865 | 5,149,139 |
Source: Central Statistics Office, Ireland.
Further information about the population structure:
| Gender (C 2022) | |
|---|---|
| Males | 51,883 |
| Females | 52,277 |
| Age Groups (C 2022) | |
|---|---|
| 0-17 years | 25,603 |
| 18-64 years | 61,501 |
| 65+ years | 17,056 |
| Age Distribution (C 2022) | |
|---|---|
| 90+ years | 616 |
| 80-89 years | 3,395 |
| 70-79 years | 7,807 |
| 60-69 years | 11,311 |
| 50-59 years | 13,776 |
| 40-49 years | 15,966 |
| 30-39 years | 12,945 |
| 20-29 years | 10,202 |
| 10-19 years | 15,034 |
| 0-9 years | 13,108 |
| Country of Birth (C 2022) | |
|---|---|
| Ireland | 88,992 |
| Other country | 15,168 |
| Religion (C 2022) | |
|---|---|
| Catholic | 80,296 |
| Other Religion | 7,596 |
| No Religion | 11,589 |