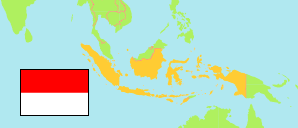
Manggarai
Regency in Eastern Lesser Sunda Islands Province
Contents: Population
The population development in Manggarai as well as related information and services (Wikipedia, Google, images).
| Name | Status | Population Census 2005-06-30 | Population Census 2010-05-01 | Population Census 2015-05-01 | Population Census 2020-09-15 | |
|---|---|---|---|---|---|---|
| Manggarai | Regency | ... | 292,451 | 319,157 | 312,855 | |
| Nusa Tenggara Timur [Eastern Lesser Sunda Islands] | Province | 4,260,294 | 4,683,827 | 5,112,760 | 5,325,566 |
Source: Badan Pusat Statistik, Republik Indonesia (web).
Explanation: 2005 and 2015 figures are result of an intermediate census.
Further information about the population structure:
| Gender (C 2020) | |
|---|---|
| Males | 156,395 |
| Females | 156,460 |
| Age Groups (C 2020) | |
|---|---|
| 0-14 years | 98,196 |
| 15-59 years | 200,624 |
| 65+ years | 14,035 |
| Age Distribution (C 2020) | |
|---|---|
| 90+ years | 50 |
| 80-89 years | 1,343 |
| 70-79 years | 6,306 |
| 60-69 years | 15,193 |
| 50-59 years | 27,691 |
| 40-49 years | 35,452 |
| 30-39 years | 41,452 |
| 20-29 years | 56,311 |
| 10-19 years | 61,515 |
| 0-9 years | 67,542 |