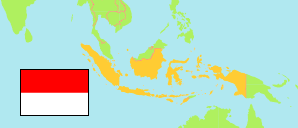
Maluku Utara
Province in Indonesia
Contents: Subdivision
The population development in Maluku Utara as well as related information and services (Wikipedia, Google, images).
| Name | Status | Population Census 2005-06-30 | Population Census 2010-05-01 | Population Census 2015-05-01 | Population Census 2020-09-15 | |
|---|---|---|---|---|---|---|
| Maluku Utara [Northern Moluccas] | Province | 884,142 | 1,038,087 | 1,160,275 | 1,282,937 | |
| Halmahera Barat [West Halmahera] | Regency | 91,540 | 100,424 | 110,528 | 132,349 | → |
| Halmahera Selatan [South Halmahera] | Regency | 170,180 | 198,911 | 219,559 | 248,395 | → |
| Halmahera Tengah [Central Halmahera] | Regency | 32,071 | 42,815 | 49,698 | 56,802 | → |
| Halmahera Timur [East Halmahera] | Regency | 56,836 | 73,109 | 84,970 | 91,707 | → |
| Halmahera Utara [North Halmahera] | Regency | ... | 161,847 | 179,783 | 197,638 | → |
| Kepulauan Sula [Sula Islands] | Regency | ... | 85,215 | 95,086 | 104,082 | → |
| Kota Ternate | City | 156,735 | 185,705 | 212,527 | 205,001 | → |
| Kota Tidore Kepulauan [Tidore Islands] | City | 78,025 | 90,055 | 96,910 | 114,480 | → |
| Pulau Morotai [Morotai Island] | Regency | ... | 52,697 | 60,606 | 74,436 | → |
| Pulau Taliabu [Taliabu Island] | Regency | ... | 47,309 | 50,608 | 58,047 | → |
| Indonesia | Republic | 218,868,791 | 237,641,326 | 255,182,144 | 270,203,917 |
Source: Badan Pusat Statistik, Republik Indonesia (web).
Explanation: 2005 and 2015 figures are result of an intermediate census.
Further information about the population structure:
| Gender (C 2020) | |
|---|---|
| Males | 657,411 |
| Females | 625,526 |
| Age Groups (C 2020) | |
|---|---|
| 0-14 years | 359,771 |
| 15-59 years | 870,279 |
| 65+ years | 52,887 |
| Age Distribution (C 2020) | |
|---|---|
| 90+ years | 280 |
| 80-89 years | 4,706 |
| 70-79 years | 22,553 |
| 60-69 years | 61,309 |
| 50-59 years | 108,572 |
| 40-49 years | 161,959 |
| 30-39 years | 204,621 |
| 20-29 years | 237,863 |
| 10-19 years | 243,055 |
| 0-9 years | 238,019 |