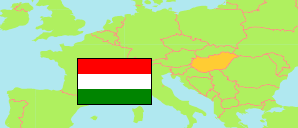
Hajdú-Bihar
County in Hungary
Contents: Subdivision
The population development in Hajdú-Bihar as well as related information and services (Wikipedia, Google, images).
| Name | Status | Population Census 1980-01-01 | Population Census 1990-01-01 | Population Census 2001-02-01 | Population Census 2011-10-01 | Population Census 2022-10-01 | |
|---|---|---|---|---|---|---|---|
| Hajdú-Bihar | County | 551,448 | 548,728 | 552,998 | 546,721 | 519,141 | |
| Balmazújváros | District | 33,767 | 32,099 | 31,858 | 30,191 | 28,892 | → |
| Berettyóújfalu | District | 55,128 | 50,781 | 48,013 | 44,995 | 41,103 | → |
| Debrecen | District | 205,834 | 219,969 | 221,711 | 224,448 | 213,858 | → |
| Derecske | District | 43,359 | 39,614 | 41,229 | 41,701 | 40,709 | → |
| Hajdúböszörmény | District | 42,115 | 40,317 | 41,456 | 40,568 | 37,654 | → |
| Hajdúhadház | District | 19,236 | 19,022 | 21,332 | 22,183 | 22,768 | → |
| Hajdúnánás | District | 32,324 | 31,829 | 31,258 | 29,614 | 28,054 | → |
| Hajdúszoboszló | District | 42,009 | 42,161 | 42,793 | 43,061 | 41,884 | → |
| Nyíradony | District | 31,077 | 28,787 | 30,343 | 29,534 | 27,952 | → |
| Püspökladány | District | 46,599 | 44,149 | 43,005 | 40,426 | 36,267 | → |
| Magyarország [Hungary] | Country | 10,709,463 | 10,374,823 | 10,198,315 | 9,937,628 | 9,603,634 |
Source: Hungarian Central Statistical Office.
Explanation: 2022 census results are final.
Further information about the population structure:
| Gender (C 2022) | |
|---|---|
| Males | 251,328 |
| Females | 267,813 |
| Age Groups (C 2022) | |
|---|---|
| 0-17 years | 95,064 |
| 18-64 years | 323,631 |
| 65+ years | 100,446 |
| Age Distribution (C 2022) | |
|---|---|
| 90+ years | 2,815 |
| 80-89 years | 19,101 |
| 70-79 years | 44,368 |
| 60-69 years | 65,464 |
| 50-59 years | 68,458 |
| 40-49 years | 79,057 |
| 30-39 years | 66,275 |
| 20-29 years | 65,879 |
| 10-19 years | 53,823 |
| 0-9 years | 53,901 |