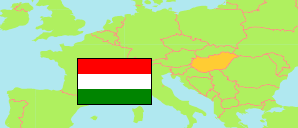
Fejér
County in Hungary
Contents: Subdivision
The population development in Fejér as well as related information and services (Wikipedia, Google, images).
| Name | Status | Population Census 1980-01-01 | Population Census 1990-01-01 | Population Census 2001-02-01 | Population Census 2011-10-01 | Population Census 2022-10-01 | |
|---|---|---|---|---|---|---|---|
| Fejér | County | 420,317 | 418,852 | 434,317 | 425,847 | 419,656 | |
| Bicske | District | 33,382 | 31,819 | 34,569 | 35,231 | 36,091 | → |
| Dunaújváros | District | 100,274 | 98,060 | 100,438 | 94,414 | 88,613 | → |
| Enying | District | 23,274 | 21,762 | 21,871 | 20,614 | 19,532 | → |
| Gárdony | District | 22,562 | 23,815 | 26,594 | 29,406 | 36,499 | → |
| Martonvásár | District | 23,446 | 22,495 | 27,005 | 28,040 | 29,152 | → |
| Mór | District | 34,210 | 34,207 | 34,781 | 34,626 | 33,762 | → |
| Sárbogárd | District | 30,943 | 29,906 | 30,199 | 28,296 | 26,343 | → |
| Székesfehérvár | District | 152,226 | 156,788 | 158,860 | 155,220 | 149,664 | → |
| Magyarország [Hungary] | Country | 10,709,463 | 10,374,823 | 10,198,315 | 9,937,628 | 9,603,634 |
Source: Hungarian Central Statistical Office.
Explanation: 2022 census results are final.
Further information about the population structure:
| Gender (C 2022) | |
|---|---|
| Males | 205,208 |
| Females | 214,448 |
| Age Groups (C 2022) | |
|---|---|
| 0-17 years | 74,772 |
| 18-64 years | 260,436 |
| 65+ years | 84,448 |
| Age Distribution (C 2022) | |
|---|---|
| 90+ years | 2,124 |
| 80-89 years | 15,453 |
| 70-79 years | 37,364 |
| 60-69 years | 54,920 |
| 50-59 years | 56,629 |
| 40-49 years | 71,881 |
| 30-39 years | 54,846 |
| 20-29 years | 43,612 |
| 10-19 years | 41,107 |
| 0-9 years | 41,720 |