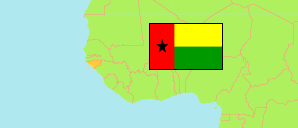
Regions
The population of the regions of Guinea-Bissau according to census results and latest official projections.
| Name | Abbr. | Status | Capital | Area A (km²) | Population Census (C) 1979-04-16 | Population Census (C) 1991-12-01 | Population Census (Cfa) 2009-03-01 | Population Projection (P) 2022-07-01 | |||
|---|---|---|---|---|---|---|---|---|---|---|---|
| Guinea-Bissau | GNB | Rep | Bissau | 36,125 | 767,469 | 979,209 | 1,520,830 | 1,723,900 | |||
| Bafatá | BA | Reg | Bafatá | 5,981 | 116,032 | 145,088 | 210,007 | ... | 598100 | ||
| Biombo | BM | Reg | Quinhámel | 840 | 56,463 | 59,827 | 97,120 | ... | 84000 | ||
| Bissau (Setor Autônomo de Bissau, SAB) | BS | Cap | Bissau | 78 | 109,214 | 195,389 | 387,909 | ... | 7800 | ||
| Bolama (Bijagos) | BL | Reg | Bolama | 2,624 | 25,473 | 26,891 | 34,563 | ... | 262400 | ||
| Cacheu | CA | Reg | Cacheu | 5,175 | 130,227 | 146,570 | 192,508 | ... | 517500 | ||
| Gabú | GA | Reg | Gabú | 9,150 | 104,315 | 136,101 | 215,530 | ... | 915000 | ||
| Oio | OI | Reg | Bissorã | 5,403 | 135,114 | 155,312 | 224,644 | ... | 540300 | ||
| Quinara | QU | Reg | Fulacunda | 3,138 | 35,532 | 42,966 | 63,610 | ... | 313800 | ||
| Tombali | TO | Reg | Catió | 3,736 | 55,099 | 71,065 | 94,939 | ... | 373600 |
- The final census result of 1,449,230 is adjusted by 67,904 estimating the number of omissions and by 3,696 persons living in orphanages and religious houses.
- (1979) UN Demographic Yearbook 1983.
(1991) UN Statistics Division (web).
(2009) (2022) Instituto Nacional de Estatística Guiné-Bissau (web).
Major Cities
| Name | Adm. | Population Census (Cfa) 2009-03-01 | |
|---|---|---|---|
| 1 | Bissau | BS | 387,909 |
| 2 | Gabú | GA | 43,556 |
| 3 | Bafatá | BA | 29,556 |
| 4 | Canchungo | CA | 12,044 |
| 5 | Bissorã | OI | 9,898 |
| 6 | Bula | CA | 9,010 |
| 7 | Farim | OI | 9,005 |
| 8 | Mansôa | OI | 8,313 |
| 9 | Ingoré | CA | 8,107 |
| 10 | Buba | QU | 7,898 |
Contents: Cities & Urban Localities
The population of all cities and urban localities in Guinea-Bissau by census years.
| Name | Adm. | Population Census (C) 1979-04-16 | Population Census (Cfa) 2009-03-01 | Area | |
|---|---|---|---|---|---|
| Bafatá | BA | 13,429 | 29,556 | 0 | |
| Bambadinca | BA | ... | 6,723 | 0 | |
| Bedanda | TO | ... | 691 | 0 | |
| Bissau | BS | 109,214 | 387,909 | 0 | |
| Bissorã | OI | ... | 9,898 | 0 | |
| Bolama | BL | ... | 5,026 | 0 | |
| Buba | QU | ... | 7,898 | 0 | |
| Bubaque | BL | ... | 4,484 | 0 | |
| Bula | CA | ... | 9,010 | 0 | |
| Cacheu | CA | ... | 5,891 | 0 | |
| Cacine | TO | ... | 1,016 | 0 | |
| Caió | CA | ... | 1,234 | 0 | |
| Canchungo | CA | 4,965 | 12,044 | 0 | |
| Catió | TO | 5,170 | 5,081 | 0 | |
| Contuboel | BA | ... | 4,298 | 0 | |
| Empada | QU | ... | 2,365 | 0 | |
| Farim | OI | 4,468 | 9,005 | 0 | |
| Fulacunda | QU | ... | 1,592 | 0 | |
| Gabú (Nova Lamego) | GA | 7,803 | 43,556 | 0 | |
| Ingoré | CA | ... | 8,107 | 0 | |
| Komo | TO | ... | 1,242 | 0 | |
| Mansaba | OI | ... | 5,262 | 0 | |
| Mansôa | OI | 5,390 | 8,313 | 0 | |
| Nhacra | OI | ... | 1,735 | 0 | |
| Piche (Pitche) | GA | ... | 4,989 | 0 | |
| Pirada | GA | ... | 2,629 | 0 | |
| Prabis | BM | ... | 2,844 | 0 | |
| Quebo | TO | ... | 5,454 | 0 | |
| Quinhámel | BM | ... | 5,825 | 0 | |
| Safim | BM | ... | 2,817 | 0 | |
| São Domingos | CA | ... | 5,297 | 0 | |
| Sonaco | GA | ... | 2,429 | 0 | |
| Tite | QU | ... | 979 | 0 |
- (1979) The Europa World Year Book 1987.
(2009) Instituto Nacional de Estatística Guiné-Bissau (web). The population of cities and localities is adjusted by regional factors estimating the number of omissions; they do not consider (with exception of Bissau) people living in orphanages and religious houses (in maximum 3,145 persons).
