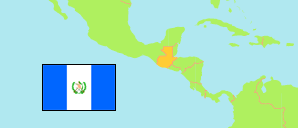
Sacatepéquez
Department in Guatemala
Contents: Subdivision
The population development in Sacatepéquez as well as related information and services (Wikipedia, Google, images).
| Name | Status | Population Estimate 2008-06-30 | Population Estimate 2018-06-30 | Population Projection 2023-06-30 | |
|---|---|---|---|---|---|
| Sacatepéquez | Department | 296,890 | 377,219 | 408,476 | |
| Alotenango | Municipality | 22,954 | 27,086 | 28,792 | → |
| Antigua Guatemala | Municipality | 44,101 | 56,898 | 60,608 | → |
| Ciudad Vieja | Municipality | 32,337 | 38,181 | 42,815 | → |
| Jocotenango | Municipality | 20,021 | 22,484 | 24,144 | → |
| Magdalena Milpas Altas | Municipality | 9,999 | 12,478 | 12,936 | → |
| Pastores | Municipality | 13,904 | 18,817 | 20,190 | → |
| San Antonio Aguas Calientes | Municipality | 9,703 | 11,883 | 13,279 | → |
| San Bartolomé Milpas Altas | Municipality | 7,380 | 8,256 | 8,879 | → |
| San Lucas Sacatepéquez | Municipality | 22,808 | 27,681 | 29,549 | → |
| San Miguel Dueñas | Municipality | 10,510 | 14,562 | 16,218 | → |
| Santa Catarina Barahona | Municipality | 3,307 | 4,304 | 4,746 | → |
| Santa Lucía Milpas Altas | Municipality | 13,258 | 16,447 | 17,989 | → |
| Santa María de Jesús | Municipality | 15,952 | 25,857 | 27,346 | → |
| Santiago Sacatepéquez | Municipality | 26,881 | 35,250 | 38,111 | → |
| Santo Domingo Xenacoj | Municipality | 9,506 | 13,457 | 15,134 | → |
| Sumpango | Municipality | 34,268 | 43,578 | 47,740 | → |
| Guatemala | Republic | 13,677,815 | 16,346,950 | 17,602,431 |
Source: Instituto Nacional de Estadistica Guatemala.
Explanation: In contrast to the population estimates and projections in the table above, the census figures used by the following information about population structure are not adjusted for underenumeration. The area figures of municipalities are computed by using geospatial data.
Further information about the population structure:
| Gender (P 2023) | |
|---|---|
| Males | 201,349 |
| Females | 207,127 |
| Age Groups (P 2023) | |
|---|---|
| 0-14 years | 101,570 |
| 15-64 years | 282,523 |
| 65+ years | 24,383 |
| Age Distribution (P 2023) | |
|---|---|
| 70+ years | 14,909 |
| 60-69 years | 20,798 |
| 50-59 years | 32,670 |
| 40-49 years | 52,036 |
| 30-39 years | 68,955 |
| 20-29 years | 80,083 |
| 10-19 years | 72,841 |
| 0-9 years | 66,184 |
| Urbanization (C 2018) | |
|---|---|
| Rural | 38,103 |
| Urban | 292,366 |
| Place of Birth (C 2018) | |
|---|---|
| Same municipality | 219,980 |
| Other municipality in Guatamala | 101,830 |
| Other country | 2,049 |
| Ethnic Group (C 2018) | |
|---|---|
| Maya | 132,762 |
| Garifuna | 428 |
| Xinca | 206 |
| Afro-Guatemalan | 486 |
| Ladino | 195,101 |
| Foreign | 1,486 |
| Mother Tongue (C 2018) | |
|---|---|
| Spain | 270,804 |
| Q'eqchi' | 281 |
| K'iche' | 1,624 |
| Mam | 225 |
| Kaqchikel | 29,961 |
| Other language | 3,646 |
| Literacy (A7+) (C 2018) | |
|---|---|
| yes | 259,175 |
| no | 28,126 |