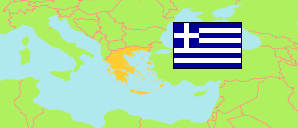
Kríti
NUTS 2 Region in Greece
Contents: Subdivision
The population development in Kríti as well as related information and services (Wikipedia, Google, images).
| Name | Status | Native | Population Estimate 2002-01-01 | Population Estimate 2007-01-01 | Population Estimate 2012-01-01 | Population Estimate 2017-01-01 | Population Estimate 2020-01-01 | |
|---|---|---|---|---|---|---|---|---|
| Kríti [Crete] | NUTS 2 Region | Κρήτη | 589,844 | 608,988 | 629,367 | 632,674 | 634,930 | |
| Nomós Chaníon [Chania] | NUTS 3 Region | Νομός Χανίων | 144,833 | 151,988 | 157,886 | 159,089 | 159,893 | → |
| Nomós Irakleíou [Heraklion] | NUTS 3 Region | Νομός Ηρακλείου | 291,398 | 299,140 | 309,131 | 311,640 | 315,162 | → |
| Nomós Lasithíou [Lasithi] | NUTS 3 Region | Νομός Λασιθίου | 74,934 | 75,194 | 75,666 | 74,463 | 73,758 | → |
| Nomós Rethýmnou [Rethymno] | NUTS 3 Region | Νομός Ρεθύμνης | 78,679 | 82,666 | 86,684 | 87,482 | 87,691 | → |
| Elláda [Greece] | Republic | Ελλάδα | 10,888,274 | 11,036,008 | 11,086,406 | 10,768,193 | 10,718,565 |
Source: General Secretariat of National Statistical Service of Greece (web).
Explanation: NUTS (Nomenclature of Territorial Units for Statistics) regions are statistical regions of the EU. The estimates consider the results and post enumeration surveys of the 1991 and 2011 census but not of the 2001 census.