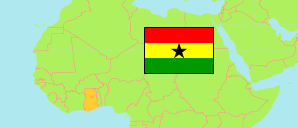
Ahafo
Region in Ghana
Contents: Subdivision
The population development in Ahafo as well as related information and services (Wikipedia, Google, images).
| Name | Status | Population Census 2010-09-26 | Population Census 2021-06-27 | |
|---|---|---|---|---|
| Ahafo (← Brong Ahafo) | Region | 484,210 | 564,668 | |
| Asunafo North Municipal | Municipal District | 124,685 | 150,198 | → |
| Asunafo South | District | 95,580 | 91,693 | → |
| Asutifi North | District | 52,259 | 73,556 | → |
| Asutifi South | District | 53,584 | 68,394 | → |
| Tano North Municipal | Municipal District | 79,973 | 93,608 | → |
| Tano South Municipal | Municipal District | 78,129 | 87,219 | → |
| Ghana | Republic | 24,658,823 | 30,832,019 |
Source: Ghana Statistical Service (web).
Explanation: Area figures of districts are derived from geospatial data.
Further information about the population structure:
| Gender (C 2021) | |
|---|---|
| Males | 285,340 |
| Females | 279,328 |
| Age Groups (C 2021) | |
|---|---|
| 0-14 years | 203,654 |
| 15-64 years | 337,981 |
| 65+ years | 23,033 |
| Age Distribution (C 2021) | |
|---|---|
| 80+ years | 5,895 |
| 70-79 years | 9,171 |
| 60-69 years | 20,195 |
| 50-59 years | 34,646 |
| 40-49 years | 52,525 |
| 30-39 years | 76,501 |
| 20-29 years | 97,569 |
| 10-19 years | 128,844 |
| 0-9 years | 139,322 |
| Urbanization (C 2021) | |
|---|---|
| Rural | 289,754 |
| Urban | 274,914 |
| Literacy (A11+) (C 2021) | |
|---|---|
| yes | 298,924 |
| no | 111,662 |
| Ethnic Group (C 2021) | |
|---|---|
| Akan | 338,330 |
| Ga-Dangme | 10,359 |
| Ewe | 28,369 |
| Guan | 3,154 |
| Gurma | 33,044 |
| Mole-Dagbani | 109,803 |
| Grusi | 12,462 |
| Mandé | 15,890 |
| Other Ethnic Group | 11,026 |