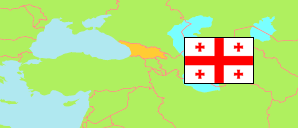
Chiatura
Municipality in Administrative Division
Contents: Population
The population development of Chiatura as well as related information and services (Wikipedia, Google, images).
| Name | Status | Native | Population Census 1989-01-12 | Population Census 2002-01-17 | Population Census 2014-11-05 | Population Census 2024-11-14 | |
|---|---|---|---|---|---|---|---|
| Chiatura | Municipality | ჭიათურის მუნიციპალიტეტი | 68,719 | 56,341 | 39,884 | 36,400 | |
| Sakartwelo [Georgia] | Areas under control of the central government | საქართველო | 4,921,955 | 4,361,876 | 3,713,804 | 3,914,000 |
Source: National Statistics Office of Georgia, pop-stat.mashke.org.
Explanation: The results of the 2024 census are preliminary. Area figures are computed by using geospatial data.
Further information about the population structure:
| Gender (C 2024) | |
|---|---|
| Males | 17,600 |
| Females | 18,800 |
| Age Groups (C 2014) | |
|---|---|
| 0-14 years | 6,739 |
| 15-64 years | 25,161 |
| 65+ years | 7,984 |
| Age Distribution (C 2014) | |
|---|---|
| 0-9 years | 4,544 |
| 10-19 years | 4,278 |
| 20-29 years | 4,276 |
| 30-39 years | 4,449 |
| 40-49 years | 4,950 |
| 50-59 years | 6,548 |
| 60-69 years | 4,769 |
| 70-79 years | 4,018 |
| 80+ years | 2,052 |
| Urbanization (C 2024) | |
|---|---|
| Rural | 24,600 |
| Urban | 11,800 |
| Internally Displaced Persons (C 2014) | |
|---|---|
| no IDP | 39,600 |
| IDP | 300 |
| Ethnic Group (C 2014) | |
|---|---|
| Georgians | 39,708 |
| Armenians | 76 |
| Other group | 97 |
| Religion (C 2014) | |
|---|---|
| Orthodox | 39,515 |
| Other religion | 174 |
| No religion | 34 |