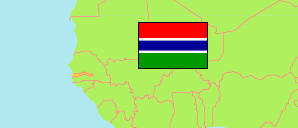
Gambia: Administrative Division
Contents: Local Government Areas and Districts
The population of the local government areas (LGAs) and districts of Gambia by census years.
| Name | Status | Population Census 1993-04-15 | Population Census 2003-04-15 | Population Census 2013-04-15 | |
|---|---|---|---|---|---|
| Banjul | Local Government Area | 42,326 | 35,061 | 31,054 | → |
| Banjul | District | 42,326 | 35,061 | 31,054 | → |
| Basse (Upper River) | Local Government Area | 155,059 | 182,586 | 237,220 | → |
| Basse Fulladu East (← Fulladu East) | District | ... | ... | 49,102 | → |
| Jimara (← Fulladu East) | District | ... | ... | 43,461 | → |
| Kantora | District | 26,502 | 30,402 | 38,354 | → |
| Sandu | District | 14,689 | 18,321 | 23,659 | → |
| Tumana (← Fulladu East) | District | ... | ... | 37,206 | → |
| Wuli East (← Wuli) | District | ... | ... | 23,612 | → |
| Wuli West (← Wuli) | District | ... | ... | 21,826 | → |
| Brikama (Western) | Local Government Area | 234,917 | 389,594 | 688,744 | → |
| Foni Bintang-Karanai | District | 11,397 | 15,994 | 17,119 | → |
| Foni Bondali | District | 4,594 | 6,049 | 7,578 | → |
| Foni Brefet | District | 8,529 | 11,411 | 14,523 | → |
| Foni Jarrol | District | 5,355 | 5,943 | 6,883 | → |
| Foni Kansala | District | 7,748 | 12,247 | 14,125 | → |
| Kombo Central | District | 56,094 | 84,315 | 140,029 | → |
| Kombo East | District | 21,028 | 28,146 | 42,330 | → |
| Kombo North (/Saint Mary) | District | 80,478 | 166,351 | 339,377 | → |
| Kombo South | District | 39,694 | 62,531 | 106,780 | → |
| Janjanbureh | Local Government Area | 88,247 | 107,212 | 125,204 | → |
| Janjanbureh (McCarthy Island) | District | 2,813 | 3,466 | 3,789 | → |
| Lower Fuladu West (← Fuladu West) | District | ... | ... | 39,804 | → |
| Niamina Dankunku | District | 6,089 | 6,000 | 6,083 | → |
| Niamina East | District | 15,402 | 19,034 | 24,340 | → |
| Niamina West | District | 5,948 | 6,630 | 7,141 | → |
| Upper Fuladu West (← Fuladu West) | District | ... | ... | 44,047 | → |
| Kanifeng | Local Government Area | 228,214 | 322,735 | 377,134 | → |
| Kanifeng | District | 228,214 | 322,410 | 377,134 | → |
| Kerewan (North Bank) | Local Government Area | 156,462 | 172,835 | 220,080 | → |
| Central Badibu | District | 15,060 | 14,998 | 19,491 | → |
| Illiasa (← Upper Badibu) | District | ... | ... | 48,620 | → |
| Jokadu | District | 14,874 | 17,850 | 22,312 | → |
| Lower Badibu | District | 14,391 | 15,157 | 17,961 | → |
| Lower Niumi | District | 35,147 | 44,491 | 57,088 | → |
| Sabach Sanjal (← Upper Badibu) | District | ... | ... | 23,728 | → |
| Upper Niumi | District | 21,552 | 24,940 | 30,880 | → |
| Kuntaur | Local Government Area | 67,774 | 78,491 | 96,703 | → |
| Lower Saloum | District | 14,179 | 13,524 | 15,446 | → |
| Niani | District | 18,531 | 22,242 | 28,343 | → |
| Nianija | District | 6,439 | 8,205 | 9,876 | → |
| Sami | District | 16,073 | 19,157 | 24,365 | → |
| Upper Saloum | District | 12,552 | 15,970 | 18,673 | → |
| Mansakonko (Lower River) | Local Government Area | 65,146 | 72,167 | 81,042 | → |
| Jarra Central | District | 6,084 | 6,494 | 8,342 | → |
| Jarra East | District | 11,272 | 12,505 | 16,034 | → |
| Jarra West | District | 20,673 | 24,416 | 26,214 | → |
| Kiang Central | District | 7,282 | 7,886 | 8,661 | → |
| Kiang East | District | 6,356 | 6,534 | 6,801 | → |
| Kiang West | District | 13,479 | 14,711 | 14,990 | → |
| Gambia | Republic | 1,038,145 | 1,360,681 | 1,857,181 |
Source: The Gambia Bureau of Statistics (web).
Explanation: Area figures of districts are computed by using geospatial data.
Further information about the population structure:
| Gender (C 2013) | |
|---|---|
| Males | 913,755 |
| Females | 943,426 |
| Age Groups (C 2013) | |
|---|---|
| 0-14 years | 792,065 |
| 15-49 years | 902,933 |
| 50+ years | 160,522 |