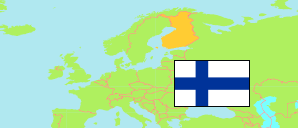
Nivala
Municipality in Finland
Contents: Population
The population development of Nivala as well as related information and services (Wikipedia, Google, images).
| Name | Status | Population Estimate 1980-12-31 | Population Estimate 1990-12-31 | Population Estimate 2000-12-31 | Population Estimate 2010-12-31 | Population Estimate 2020-12-31 | Population Estimate 2022-12-31 | |
|---|---|---|---|---|---|---|---|---|
| Nivala | Municipality | 10,515 | 11,249 | 11,079 | 11,025 | 10,500 | 10,419 | |
| Suomi [Finland] | Republic | 4,787,778 | 4,998,478 | 5,181,115 | 5,375,276 | 5,533,793 | 5,563,970 |
Source: Statistics Finland (web).
Explanation: Division of 1 January 2023.
Further information about the population structure:
| Gender (E 2022) | |
|---|---|
| Males | 5,300 |
| Females | 5,119 |
| Age Groups (E 2022) | |
|---|---|
| 0-17 years | 2,750 |
| 18-64 years | 5,180 |
| 65+ years | 2,489 |
| Age Distribution (E 2022) | |
|---|---|
| 90+ years | 132 |
| 80-89 years | 545 |
| 70-79 years | 1,145 |
| 60-69 years | 1,262 |
| 50-59 years | 1,032 |
| 40-49 years | 1,116 |
| 30-39 years | 1,167 |
| 20-29 years | 974 |
| 10-19 years | 1,707 |
| 0-9 years | 1,339 |
| Citizenship (E 2022) | |
|---|---|
| Finland | 10,334 |
| Foreign Citizenship | 85 |
| Country of Birth (E 2022) | |
|---|---|
| Finland | 10,208 |
| Other Country | 211 |
| Language (E 2022) | |
|---|---|
| Finnish | 10,299 |
| Swedish | 5 |
| Other Language | 115 |
| Urbanization (E 2021) | |
|---|---|
| Rural heartland | 10,262 |
| Sparsely populated | 52 |