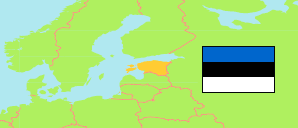
Viru-Nigula
Rural Municipality in Estonia
Contents: Population
The population development of Viru-Nigula as well as related information and services (Wikipedia, Google, images).
| Name | Status | Population Census 2000-03-31 | Population Census 2011-12-31 | Population Census 2021-12-31 | |
|---|---|---|---|---|---|
| Viru-Nigula | Rural Municipality | 7,653 | 6,422 | 5,647 | |
| Eesti [Estonia] | Republic | 1,370,052 | 1,294,455 | 1,331,824 |
Source: Statistical Office of Estonia (web).
Explanation: Counties and municipalities after the administrative reform of 2017.
Further information about the population structure:
| Gender (C 2021) | |
|---|---|
| Males | 2,714 |
| Females | 2,933 |
| Age Groups (C 2021) | |
|---|---|
| 0-17 years | 940 |
| 18-64 years | 3,177 |
| 65+ years | 1,530 |
| Age Distribution (C 2021) | |
|---|---|
| 90+ years | 59 |
| 80-89 years | 456 |
| 70-79 years | 611 |
| 60-69 years | 846 |
| 50-59 years | 823 |
| 40-49 years | 663 |
| 30-39 years | 600 |
| 20-29 years | 515 |
| 10-19 years | 593 |
| 0-9 years | 484 |
| Citizenship (C 2021) | |
|---|---|
| Estonia | 4,670 |
| Russia | 313 |
| Other Citizenship | 98 |
| Country of Birth (C 2021) | |
|---|---|
| Estonia | 4,591 |
| Russia | 768 |
| Other Country | 286 |
| First Language (C 2021) | |
|---|---|
| Estonian | 3,724 |
| Russian | 1,779 |
| Other Language | 124 |
| Ethnic Group (C 2021) | |
|---|---|
| Estonians | 3,816 |
| Russians | 1,539 |
| Other Ethnic Group | 284 |
| Religion (C 2011) | |
|---|---|
| Lutheran | 420 |
| Orthodox | 876 |
| Other Religion | 180 |
| No Religion | 3,270 |