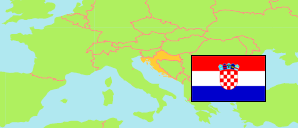
Rugvica
Municipality in Croatia
Contents: Population
The population development of Rugvica as well as related information and services (Wikipedia, Google, images).
| Name | Status | Population Census 2001-03-31 | Population Census 2011-03-31 | Population Census 2021-08-31 | Population Estimate 2024-12-31 | |
|---|---|---|---|---|---|---|
| Rugvica | Municipality | 7,608 | 7,871 | 7,133 | 7,605 | |
| Hrvatska [Croatia] | Republic | 4,437,460 | 4,284,889 | 3,871,833 | 3,874,350 |
Source: Croatian Bureau of Statistics.
Explanation: Area figures are calculated using geospatial data.
Further information about the population structure:
| Gender (E 2024) | |
|---|---|
| Males | 3,886 |
| Females | 3,719 |
| Age Groups (C 2021) | |
|---|---|
| 0-14 years | 1,063 |
| 15-64 years | 4,667 |
| 65+ years | 1,403 |
| Age Distribution (C 2021) | |
|---|---|
| 90+ years | 46 |
| 80-89 years | 286 |
| 70-79 years | 546 |
| 60-69 years | 1,106 |
| 50-59 years | 945 |
| 40-49 years | 944 |
| 30-39 years | 980 |
| 20-29 years | 819 |
| 10-19 years | 747 |
| 0-9 years | 714 |
| Citizenship (C 2021) | |
|---|---|
| Croatia | 7,105 |
| Foreign Citizenship / Stateless | 28 |
| Ethnic Group (C 2021) | |
|---|---|
| Croats | 6,722 |
| Serbs | 49 |
| Other group | 99 |
| Religion (C 2021) | |
|---|---|
| Catholics | 6,149 |
| Orthodox | 89 |
| Other Christians | 221 |
| Muslims | 139 |
| Other religion | 61 |
| No religion | 153 |