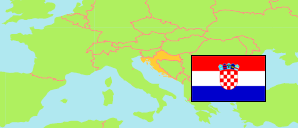
Primorje-Gorski kotar
County in Croatia
Contents: Subdivision
The population development in Primorje-Gorski kotar as well as related information and services (Wikipedia, Google, images).
| Name | Status | Population Census 2001-03-31 | Population Census 2011-03-31 | Population Census 2021-08-31 | |
|---|---|---|---|---|---|
| Primorje-Gorski kotar | County | 305,505 | 296,195 | 265,419 | |
| Bakar | Town | 7,773 | 8,279 | 7,573 | → |
| Baška | Municipality | 1,554 | 1,674 | 1,656 | → |
| Brod Moravice | Municipality | 985 | 866 | 663 | → |
| Čabar | Town | 4,387 | 3,770 | 3,226 | → |
| Čavle | Municipality | 6,749 | 7,220 | 7,059 | → |
| Cres | Town | 2,959 | 2,879 | 2,716 | → |
| Crikvenica | Town | 11,348 | 11,122 | 9,980 | → |
| Delnice | Town | 6,262 | 5,952 | 5,135 | → |
| Dobrinj | Municipality | 1,970 | 2,078 | 2,150 | → |
| Fužine | Municipality | 1,855 | 1,592 | 1,394 | → |
| Jelenje | Municipality | 4,877 | 5,344 | 5,096 | → |
| Kastav | Town | 8,891 | 10,440 | 10,202 | → |
| Klana | Municipality | 1,931 | 1,975 | 1,845 | → |
| Kostrena | Municipality | 3,897 | 4,180 | 4,398 | → |
| Kraljevica | Town | 4,579 | 4,618 | 4,066 | → |
| Krk | Town | 5,491 | 6,281 | 6,816 | → |
| Lokve | Municipality | 1,120 | 1,049 | 850 | → |
| Lopar | Municipality | 1,191 | 1,263 | 1,107 | → |
| Lovran | Municipality | 3,987 | 4,101 | 3,527 | → |
| Mali Lošinj | Town | 8,388 | 8,116 | 7,537 | → |
| Malinska-Dubašnica | Municipality | 2,726 | 3,134 | 3,212 | → |
| Matulji | Municipality | 10,544 | 11,246 | 10,773 | → |
| Mošćenička Draga | Municipality | 1,641 | 1,535 | 1,288 | → |
| Mrkopalj | Municipality | 1,407 | 1,214 | 924 | → |
| Novi Vinodolski | Town | 5,282 | 5,113 | 4,328 | → |
| Omišalj | Municipality | 2,998 | 2,983 | 2,992 | → |
| Opatija | Town | 12,719 | 11,659 | 10,619 | → |
| Punat | Municipality | 1,876 | 1,973 | 1,900 | → |
| Rab | Town | 8,289 | 8,065 | 7,161 | → |
| Ravna Gora | Municipality | 2,724 | 2,430 | 2,028 | → |
| Rijeka | Town | 144,043 | 128,624 | 107,964 | → |
| Skrad | Municipality | 1,333 | 1,062 | 858 | → |
| Vinodolska općina | Municipality | 3,530 | 3,577 | 3,226 | → |
| Viškovo | Municipality | 8,907 | 14,445 | 16,084 | → |
| Vrbnik | Municipality | 1,245 | 1,260 | 1,190 | → |
| Vrbovsko | Town | 6,047 | 5,076 | 3,876 | → |
| Hrvatska [Croatia] | Republic | 4,437,460 | 4,284,889 | 3,871,833 |
Source: Croatian Bureau of Statistics (web).
Explanation: Area figures are derived from geospatial data.
Further information about the population structure:
| Gender (C 2021) | |
|---|---|
| Males | 127,054 |
| Females | 138,365 |
| Age Groups (C 2021) | |
|---|---|
| 0-14 years | 33,058 |
| 15-64 years | 163,822 |
| 65+ years | 68,539 |
| Age Distribution (C 2021) | |
|---|---|
| 90+ years | 1,981 |
| 80-89 years | 15,120 |
| 70-79 years | 29,694 |
| 60-69 years | 42,866 |
| 50-59 years | 36,659 |
| 40-49 years | 37,867 |
| 30-39 years | 32,759 |
| 20-29 years | 24,482 |
| 10-19 years | 22,600 |
| 0-9 years | 21,391 |
| Citizenship (C 2021) | |
|---|---|
| Croatian | 262,207 |
| Foreign Citizenship / Stateless | 3,199 |
| Ethnic Group (C 2021) | |
|---|---|
| Croats | 233,859 |
| Serbs | 10,419 |
| Other group | 13,764 |
| Religion (C 2021) | |
|---|---|
| Catholic | 189,115 |
| Orthodox | 11,636 |
| Other Christians | 9,269 |
| Muslim | 7,834 |
| Other religion | 2,571 |
| No religion | 28,438 |