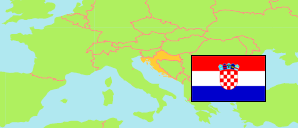
Zagreb
County in Croatia
Contents: Subdivision
The population development in Zagreb as well as related information and services (Wikipedia, Google, images).
| Name | Status | Population Census 2001-03-31 | Population Census 2011-03-31 | Population Census 2021-08-31 | Population Estimate 2024-12-31 | |
|---|---|---|---|---|---|---|
| Zagreb | County | 309,696 | 317,606 | 299,985 | 309,964 | |
| Bedenica | Municipality | 1,522 | 1,432 | 1,266 | 1,256 | → |
| Bistra | Municipality | 6,098 | 6,632 | 6,444 | 6,560 | → |
| Brckovljani | Municipality | 6,675 | 6,837 | 5,876 | 6,149 | → |
| Brdovec | Municipality | 10,287 | 11,134 | 10,737 | 10,796 | → |
| Dubrava | Municipality | 5,478 | 5,245 | 4,520 | 4,420 | → |
| Dubravica | Municipality | 1,586 | 1,437 | 1,192 | 1,174 | → |
| Dugo Selo | Town | 14,441 | 17,466 | 17,676 | 19,163 | → |
| Farkaševac | Municipality | 2,102 | 1,937 | 1,562 | 1,498 | → |
| Gradec | Municipality | 3,920 | 3,681 | 3,189 | 3,137 | → |
| Ivanić-Grad | Town | 14,723 | 14,548 | 12,982 | 13,091 | → |
| Jakovlje | Municipality | 3,952 | 3,930 | 3,797 | 3,918 | → |
| Jastrebarsko | Town | 16,689 | 15,866 | 14,562 | 15,076 | → |
| Klinča Sela | Municipality | 4,927 | 5,231 | 5,044 | 5,294 | → |
| Kloštar Ivanić | Municipality | 6,038 | 6,091 | 5,523 | 5,487 | → |
| Krašić | Municipality | 3,199 | 2,640 | 2,250 | 2,194 | → |
| Kravarsko | Municipality | 1,983 | 1,987 | 1,824 | 1,830 | → |
| Križ | Municipality | 7,406 | 6,963 | 6,098 | 6,009 | → |
| Luka | Municipality | 1,419 | 1,351 | 1,265 | 1,284 | → |
| Marija Gorica | Municipality | 2,089 | 2,233 | 2,094 | 2,129 | → |
| Orle | Municipality | 2,145 | 1,975 | 1,765 | 1,823 | → |
| Pisarovina | Municipality | 3,697 | 3,689 | 3,484 | 3,544 | → |
| Pokupsko | Municipality | 2,492 | 2,224 | 1,926 | 1,829 | → |
| Preseka | Municipality | 1,617 | 1,448 | 1,129 | 1,051 | → |
| Pušća | Municipality | 2,484 | 2,700 | 2,564 | 2,592 | → |
| Rakovec | Municipality | 1,350 | 1,252 | 1,141 | 1,087 | → |
| Rugvica | Municipality | 7,608 | 7,871 | 7,133 | 7,605 | → |
| Samobor | Town | 36,206 | 37,633 | 37,435 | 38,536 | → |
| Stupnik | Municipality | 3,251 | 3,735 | 3,886 | 4,336 | → |
| Sveta Nedelja | Town | 15,506 | 18,059 | 18,221 | 19,779 | → |
| Sveti Ivan Zelina | Town | 16,268 | 15,959 | 14,602 | 15,144 | → |
| Velika Gorica | Town | 63,517 | 63,517 | 61,075 | 63,841 | → |
| Vrbovec | Town | 14,711 | 14,797 | 12,981 | 13,223 | → |
| Zaprešić | Town | 23,125 | 25,223 | 24,133 | 24,572 | → |
| Žumberak | Municipality | 1,185 | 883 | 609 | 537 | → |
| Hrvatska [Croatia] | Republic | 4,437,460 | 4,284,889 | 3,871,833 | 3,874,350 |
Source: Croatian Bureau of Statistics.
Explanation: Area figures are calculated using geospatial data.
Further information about the population structure:
| Gender (E 2024) | |
|---|---|
| Males | 153,545 |
| Females | 156,419 |
| Age Groups (C 2021) | |
|---|---|
| 0-14 years | 44,605 |
| 15-64 years | 191,459 |
| 65+ years | 63,921 |
| Age Distribution (C 2021) | |
|---|---|
| 90+ years | 1,613 |
| 80-89 years | 12,516 |
| 70-79 years | 28,275 |
| 60-69 years | 42,789 |
| 50-59 years | 41,019 |
| 40-49 years | 43,158 |
| 30-39 years | 37,281 |
| 20-29 years | 33,123 |
| 10-19 years | 31,782 |
| 0-9 years | 28,429 |
| Citizenship (C 2021) | |
|---|---|
| Croatia | 298,382 |
| Foreign Citizenship / Stateless | 1,599 |
| Ethnic Group (C 2021) | |
|---|---|
| Croats | 289,929 |
| Serbs | 1,789 |
| Other group | 4,585 |
| Religion (C 2021) | |
|---|---|
| Catholics | 250,023 |
| Orthodox | 2,399 |
| Other Christians | 18,358 |
| Muslims | 2,667 |
| Other religion | 2,819 |
| No religion | 14,554 |