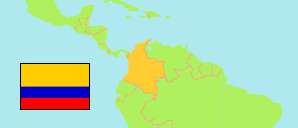
Colombia: Bogotá
Contents: Boroughs
The population of the boroughs of the Municipal Capital of Bogotá according to the last census.
| Name | Status | Population Census 2018-06-30 | |
|---|---|---|---|
| Antonio Nariño (Localidad 15) | Borough | 76,646 | → |
| Barrios Unidos (Localidad 12) | Borough | 126,294 | → |
| Bosa (Localidad 7) | Borough | 671,181 | → |
| Chapinero (Localidad 2) | Borough | 151,024 | → |
| Ciudad Bolívar (Localidad 19) | Borough | 584,030 | → |
| Engativá (Localidad 10) | Borough | 768,777 | → |
| Fontibón (Localidad 9) | Borough | 354,322 | → |
| Kennedy (Localidad 8) | Borough | 987,731 | → |
| La Candelaria (Localidad 17) | Borough | 15,959 | → |
| Los Mártires (Localidad 14) | Borough | 69,966 | → |
| Puente Aranda (Localidad 16) | Borough | 231,090 | → |
| Rafael Uribe Uribe (Localidad 18) | Borough | 344,769 | → |
| San Cristóbal (Localidad 4) | Borough | 371,857 | → |
| Santa Fe (Localidad 3) | Borough | 99,798 | → |
| Suba (Localidad 11) | Borough | 1,113,416 | → |
| Teusaquillo (Localidad 13) | Borough | 139,643 | → |
| Tunjuelito (Localidad 6) | Borough | 165,891 | → |
| Usaquén (Localidad 1) | Borough | 518,625 | → |
| Usme (Localidad 5) | Borough | 343,423 | → |
| Bogotá | Municipal Capital | 7,387,400 |
Source: Departamento Administrativo Nacional de Estadistica, Republica de Columbia (web).
Explanation: The boundaries, population and area figures of boroughs refer only to the municipal capital, i.e. the urban main area of the municipality. They are determined by using stastistical neighborhoods whose boundaries sometimes slightly deviate from borough boundaries. Their population figures is not adjusted for underenumeration; some counted persons are not assigned to any borough. Area figures are computed by using geospatial data.
Further information about the population structure:
| Gender (C 2018) | |
|---|---|
| Males | 3,531,374 |
| Females | 3,856,026 |
| Age Groups (C 2018) | |
|---|---|
| 0-14 years | 1,330,418 |
| 15-64 years | 5,200,649 |
| 65+ years | 635,182 |
| Age Distribution (C 2018) | |
|---|---|
| 0-9 years | 857,867 |
| 10-19 years | 1,026,844 |
| 20-29 years | 1,373,654 |
| 30-39 years | 1,180,896 |
| 40-49 years | 931,082 |
| 50-59 years | 850,838 |
| 60-69 years | 536,394 |
| 70-79 years | 270,209 |
| 80-89 years | 115,581 |
| 90+ years | 22,884 |