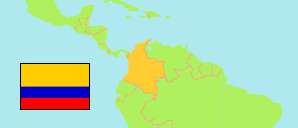
La Jagua del Pilar
Municipality in Colombia
Contents: Population
The population development of La Jagua del Pilar as well as related information and services (Wikipedia, Google, images).
| Name | Status | Population Estimate 2005-06-30 | Population Estimate 2010-06-30 | Population Estimate 2015-06-30 | Population Projection 2020-06-30 | |
|---|---|---|---|---|---|---|
| La Jagua del Pilar | Municipality | 2,285 | 2,765 | 3,086 | 3,804 | |
| Colombia | Republic | 41,927,699 | 44,349,775 | 46,431,100 | 50,407,647 |
Source: Departamento Administrativo Nacional de Estadistica, Republica de Columbia.
Explanation: Municipalities as defined in 2020. All population figures consider the result of the 2018 census.
Further information about the population structure:
| Gender (E 2020) | |
|---|---|
| Males | 2,013 |
| Females | 1,791 |
| Age Groups (E 2020) | |
|---|---|
| 0-14 years | 1,177 |
| 15-64 years | 2,376 |
| 65+ years | 251 |
| Age Distribution (E 2020) | |
|---|---|
| 80+ years | 61 |
| 70-79 years | 104 |
| 60-69 years | 191 |
| 50-59 years | 337 |
| 40-49 years | 412 |
| 30-39 years | 504 |
| 20-29 years | 638 |
| 10-19 years | 797 |
| 0-9 years | 760 |