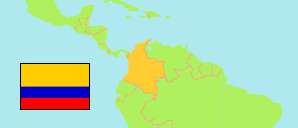
Casanare
Department in Colombia
Contents: Subdivision
The population development in Casanare as well as related information and services (Wikipedia, Google, images).
| Name | Status | Population Estimate 2005-06-30 | Population Estimate 2010-06-30 | Population Estimate 2015-06-30 | Population Projection 2020-06-30 | |
|---|---|---|---|---|---|---|
| Casanare | Department | 295,821 | 341,508 | 388,353 | 443,532 | |
| Aguazul | Municipality | 28,986 | 31,975 | 35,001 | 38,565 | → |
| Chámeza | Municipality | 1,755 | 2,039 | 2,201 | 2,474 | → |
| Hato Corozal | Municipality | 10,075 | 11,719 | 12,811 | 12,933 | → |
| La Salina | Municipality | 1,255 | 1,474 | 1,534 | 1,384 | → |
| Maní | Municipality | 11,024 | 14,005 | 16,001 | 17,487 | → |
| Monterrey | Municipality | 12,081 | 13,976 | 16,875 | 18,292 | → |
| Nunchía | Municipality | 8,222 | 9,590 | 9,554 | 9,270 | → |
| Orocué | Municipality | 7,697 | 8,970 | 11,003 | 13,069 | → |
| Paz de Ariporo | Municipality | 26,649 | 29,549 | 33,703 | 38,236 | → |
| Pore | Municipality | 7,901 | 10,358 | 11,621 | 12,231 | → |
| Recetor | Municipality | 1,588 | 1,747 | 1,504 | 1,580 | → |
| Sabanalarga | Municipality | 3,425 | 3,976 | 4,167 | 3,793 | → |
| Sácama | Municipality | 1,710 | 2,090 | 1,935 | 2,209 | → |
| San Luis de Palenque | Municipality | 7,260 | 8,813 | 8,982 | 8,585 | → |
| Támara | Municipality | 6,719 | 7,842 | 8,181 | 6,854 | → |
| Tauramena | Municipality | 16,748 | 18,643 | 21,312 | 24,920 | → |
| Trinidad | Municipality | 11,621 | 13,387 | 12,949 | 14,052 | → |
| Villanueva | Municipality | 21,896 | 25,400 | 30,364 | 37,447 | → |
| Yopal | Municipality | 109,209 | 125,955 | 148,655 | 180,151 | → |
| Colombia | Republic | 41,927,699 | 44,349,775 | 46,431,100 | 50,407,647 |
Source: Departamento Administrativo Nacional de Estadistica, Republica de Columbia.
Explanation: Municipalities as defined in 2020. All population figures consider the result of the 2018 census.
Further information about the population structure:
| Gender (E 2020) | |
|---|---|
| Males | 223,598 |
| Females | 219,934 |
| Age Groups (E 2020) | |
|---|---|
| 0-14 years | 118,684 |
| 15-64 years | 298,781 |
| 65+ years | 26,067 |
| Age Distribution (E 2020) | |
|---|---|
| 80+ years | 5,061 |
| 70-79 years | 11,193 |
| 60-69 years | 23,828 |
| 50-59 years | 40,740 |
| 40-49 years | 56,476 |
| 30-39 years | 70,219 |
| 20-29 years | 77,886 |
| 10-19 years | 78,547 |
| 0-9 years | 79,582 |