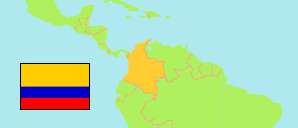
Risaralda
Department in Colombia
Contents: Subdivision
The population development in Risaralda as well as related information and services (Wikipedia, Google, images).
| Name | Status | Population Estimate 2005-06-30 | Population Estimate 2010-06-30 | Population Estimate 2015-06-30 | Population Projection 2020-06-30 | |
|---|---|---|---|---|---|---|
| Risaralda | Department | 903,687 | 936,744 | 947,125 | 962,779 | |
| Apía | Municipality | 13,475 | 14,402 | 12,940 | 12,549 | → |
| Balboa | Municipality | 6,419 | 6,913 | 6,443 | 6,476 | → |
| Belén de Umbría | Municipality | 27,990 | 26,661 | 25,341 | 25,078 | → |
| Dosquebradas | Municipality | 182,426 | 194,473 | 207,239 | 222,717 | → |
| Guática | Municipality | 15,851 | 13,298 | 12,585 | 12,325 | → |
| La Celia | Municipality | 8,726 | 8,559 | 7,736 | 7,596 | → |
| La Virginia | Municipality | 31,583 | 32,987 | 30,820 | 28,337 | → |
| Marsella | Municipality | 21,710 | 22,958 | 18,738 | 17,094 | → |
| Mistrató | Municipality | 13,064 | 14,078 | 14,557 | 17,344 | → |
| Pereira | Municipality | 450,393 | 467,949 | 475,033 | 477,068 | → |
| Pueblo Rico | Municipality | 12,001 | 12,965 | 13,602 | 16,549 | → |
| Quinchía | Municipality | 33,654 | 29,960 | 28,327 | 27,689 | → |
| Santa Rosa de Cabal | Municipality | 70,920 | 74,966 | 79,154 | 79,172 | → |
| Santuario | Municipality | 15,475 | 16,575 | 14,610 | 12,785 | → |
| Colombia | Republic | 41,927,699 | 44,349,775 | 46,431,100 | 50,407,647 |
Source: Departamento Administrativo Nacional de Estadistica, Republica de Columbia.
Explanation: Municipalities as defined in 2020. All population figures consider the result of the 2018 census.
Further information about the population structure:
| Gender (E 2020) | |
|---|---|
| Males | 460,389 |
| Females | 502,390 |
| Age Groups (E 2020) | |
|---|---|
| 0-14 years | 191,564 |
| 15-64 years | 655,431 |
| 65+ years | 115,784 |
| Age Distribution (E 2020) | |
|---|---|
| 80+ years | 23,504 |
| 70-79 years | 51,060 |
| 60-69 years | 92,659 |
| 50-59 years | 117,649 |
| 40-49 years | 120,651 |
| 30-39 years | 139,299 |
| 20-29 years | 154,831 |
| 10-19 years | 136,951 |
| 0-9 years | 126,175 |