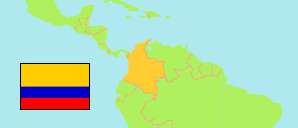
Quindío
Department in Colombia
Contents: Subdivision
The population development in Quindío as well as related information and services (Wikipedia, Google, images).
| Name | Status | Population Estimate 2005-06-30 | Population Estimate 2010-06-30 | Population Estimate 2015-06-30 | Population Projection 2020-06-30 | |
|---|---|---|---|---|---|---|
| Quindío | Department | 545,260 | 551,570 | 547,423 | 553,321 | |
| Armenia | Municipality | 286,130 | 291,180 | 295,805 | 302,613 | → |
| Buenavista | Municipality | 3,114 | 3,121 | 3,060 | 3,165 | → |
| Calarcá | Municipality | 75,302 | 75,610 | 73,446 | 74,602 | → |
| Circasia | Municipality | 28,154 | 28,410 | 27,998 | 28,946 | → |
| Córdoba | Municipality | 5,491 | 5,720 | 5,709 | 5,780 | → |
| Filandia | Municipality | 13,137 | 13,123 | 12,252 | 12,363 | → |
| Génova | Municipality | 9,798 | 9,833 | 8,823 | 7,629 | → |
| La Tebaida | Municipality | 34,632 | 34,169 | 33,631 | 34,375 | → |
| Montenegro | Municipality | 40,743 | 41,173 | 38,967 | 37,595 | → |
| Pijao | Municipality | 6,751 | 6,775 | 6,302 | 5,339 | → |
| Quimbaya | Municipality | 34,627 | 34,977 | 33,333 | 31,362 | → |
| Salento | Municipality | 7,381 | 7,479 | 8,097 | 9,552 | → |
| Colombia | Republic | 41,927,699 | 44,349,775 | 46,431,100 | 50,407,647 |
Source: Departamento Administrativo Nacional de Estadistica, Republica de Columbia.
Explanation: Municipalities as defined in 2020. All population figures consider the result of the 2018 census.
Further information about the population structure:
| Gender (E 2020) | |
|---|---|
| Males | 266,678 |
| Females | 286,643 |
| Age Groups (E 2020) | |
|---|---|
| 0-14 years | 99,957 |
| 15-64 years | 380,373 |
| 65+ years | 72,991 |
| Age Distribution (E 2020) | |
|---|---|
| 80+ years | 15,105 |
| 70-79 years | 32,004 |
| 60-69 years | 57,764 |
| 50-59 years | 71,852 |
| 40-49 years | 70,328 |
| 30-39 years | 78,053 |
| 20-29 years | 88,448 |
| 10-19 years | 74,295 |
| 0-9 years | 65,472 |