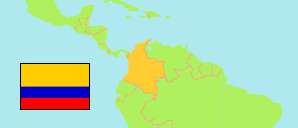
Norte de Santander
Department in Colombia
Contents: Subdivision
The population development in Norte de Santander as well as related information and services (Wikipedia, Google, images).
| Name | Status | Population Estimate 2005-06-30 | Population Estimate 2010-06-30 | Population Estimate 2015-06-30 | Population Projection 2020-06-30 | |
|---|---|---|---|---|---|---|
| Norte de Santander | Department | 1,255,447 | 1,332,538 | 1,391,555 | 1,617,209 | |
| Ábrego | Municipality | 33,360 | 33,554 | 33,228 | 34,172 | → |
| Arboledas | Municipality | 8,914 | 9,511 | 9,432 | 10,395 | → |
| Bochalema | Municipality | 6,839 | 7,329 | 7,602 | 8,838 | → |
| Bucarasica | Municipality | 4,679 | 5,808 | 5,868 | 6,817 | → |
| Cáchira | Municipality | 10,982 | 11,682 | 11,672 | 11,843 | → |
| Cácota | Municipality | 2,632 | 2,808 | 2,843 | 3,000 | → |
| Chinácota | Municipality | 15,302 | 16,278 | 16,120 | 18,738 | → |
| Chitagá | Municipality | 10,014 | 10,439 | 10,832 | 12,545 | → |
| Convención | Municipality | 14,528 | 15,617 | 16,927 | 19,990 | → |
| Cucutilla | Municipality | 8,655 | 9,194 | 8,780 | 8,771 | → |
| Durania | Municipality | 4,322 | 4,592 | 4,427 | 4,890 | → |
| El Carmen | Municipality | 12,226 | 12,439 | 12,625 | 14,232 | → |
| El Tarra | Municipality | 10,301 | 15,286 | 17,849 | 22,079 | → |
| El Zulia | Municipality | 20,994 | 22,871 | 24,645 | 29,071 | → |
| Gramalote | Municipality | 6,501 | 7,633 | 7,552 | 7,888 | → |
| Hacarí | Municipality | 8,403 | 9,055 | 9,426 | 10,881 | → |
| Herrán | Municipality | 4,619 | 4,963 | 5,414 | 7,366 | → |
| Labateca | Municipality | 6,000 | 6,425 | 6,447 | 6,791 | → |
| La Esperanza | Municipality | 11,297 | 10,316 | 10,684 | 12,412 | → |
| La Playa (La Playa de Belén) | Municipality | 5,977 | 6,841 | 7,106 | 8,231 | → |
| Los Patios | Municipality | 70,157 | 75,606 | 80,147 | 97,548 | → |
| Lourdes | Municipality | 3,562 | 4,015 | 4,069 | 4,274 | → |
| Mutiscua | Municipality | 3,988 | 3,740 | 3,888 | 4,553 | → |
| Ocaña | Municipality | 93,693 | 99,377 | 108,454 | 128,130 | → |
| Pamplona | Municipality | 54,459 | 50,897 | 48,403 | 53,966 | → |
| Pamplonita | Municipality | 4,929 | 4,843 | 5,040 | 5,866 | → |
| Puerto Santander | Municipality | 8,335 | 8,287 | 8,000 | 9,314 | → |
| Ragonvalia | Municipality | 7,019 | 5,863 | 5,866 | 6,381 | → |
| Salazar (Salazar de Las Palmas) | Municipality | 9,686 | 10,361 | 10,378 | 11,030 | → |
| San Calixto | Municipality | 10,142 | 11,101 | 11,307 | 13,342 | → |
| San Cayetano | Municipality | 4,644 | 5,084 | 5,564 | 7,612 | → |
| San José de Cúcuta (Cúcuta) | Municipality | 608,974 | 646,330 | 663,508 | 770,173 | → |
| Santiago | Municipality | 2,761 | 2,909 | 3,094 | 3,661 | → |
| Sardinata | Municipality | 20,188 | 23,203 | 23,589 | 27,301 | → |
| Silos | Municipality | 5,337 | 5,739 | 5,766 | 6,704 | → |
| Teorama | Municipality | 15,844 | 14,881 | 15,245 | 17,613 | → |
| Tibú | Municipality | 31,193 | 36,044 | 42,771 | 58,473 | → |
| Toledo | Municipality | 15,942 | 16,988 | 16,282 | 16,714 | → |
| Villa Caro | Municipality | 5,216 | 5,569 | 5,315 | 5,414 | → |
| Villa del Rosario | Municipality | 72,833 | 79,060 | 95,390 | 110,190 | → |
| Colombia | Republic | 41,927,699 | 44,349,775 | 46,431,100 | 50,407,647 |
Source: Departamento Administrativo Nacional de Estadistica, Republica de Columbia.
Explanation: Municipalities as defined in 2020. All population figures consider the result of the 2018 census.
Further information about the population structure:
| Gender (E 2020) | |
|---|---|
| Males | 797,612 |
| Females | 819,597 |
| Age Groups (E 2020) | |
|---|---|
| 0-14 years | 402,237 |
| 15-64 years | 1,076,984 |
| 65+ years | 137,988 |
| Age Distribution (E 2020) | |
|---|---|
| 80+ years | 31,954 |
| 70-79 years | 57,881 |
| 60-69 years | 111,410 |
| 50-59 years | 163,817 |
| 40-49 years | 194,348 |
| 30-39 years | 239,652 |
| 20-29 years | 278,820 |
| 10-19 years | 270,376 |
| 0-9 years | 268,951 |