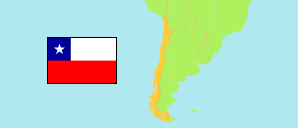
Ñuble
Region in Chile
Contents: Subdivision
The population development in Ñuble as well as related information and services (Wikipedia, Google, images).
| Name | Status | Population Estimate 2002-07-01 | Population Estimate 2007-07-01 | Population Estimate 2012-07-01 | Population Estimate 2017-07-01 | Population Projection 2023-07-01 | |
|---|---|---|---|---|---|---|---|
| Ñuble | Region | 455,240 | 468,014 | 484,129 | 500,517 | 519,437 | |
| Diguillín | Province | 295,943 | 307,327 | 320,384 | 333,394 | 348,258 | → |
| Itata | Province | 57,058 | 56,034 | 56,025 | 56,270 | 56,669 | → |
| Punilla | Province | 102,239 | 104,653 | 107,720 | 110,853 | 114,510 | → |
| Chile | Republic | 15,691,701 | 16,517,933 | 17,443,491 | 18,419,192 | 19,960,889 |
Source: Instituto Nacional de Estadísticas.
Explanation: All tabulated population figures consider the results of the 2017 census.
Further information about the population structure:
| Gender (P 2023) | |
|---|---|
| Males | 250,500 |
| Females | 268,937 |
| Age Groups (P 2023) | |
|---|---|
| 0-17 years | 113,186 |
| 18-64 years | 319,412 |
| 65+ years | 86,839 |
| Age Distribution (P 2023) | |
|---|---|
| 80+ years | 21,311 |
| 70-79 years | 37,821 |
| 60-69 years | 60,116 |
| 50-59 years | 72,870 |
| 40-49 years | 67,160 |
| 30-39 years | 70,728 |
| 20-29 years | 63,844 |
| 10-19 years | 67,000 |
| 0-9 years | 58,587 |
| Urbanization (C 2017) | |
|---|---|
| Rural | 146,929 |
| Urban | 333,680 |
| Country of Birth (C 2017) | |
|---|---|
| Chile | 476,873 |
| South America | 2,326 |
| Central America & Caribbean | 749 |
| North America | 106 |
| Europe | 398 |
| Other country & undeclared | 157 |