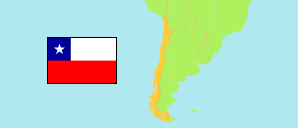
Magallanes y de la Antártica Chilena
Region in Chile
Contents: Subdivision
The population development in Magallanes y de la Antártica Chilena as well as related information and services (Wikipedia, Google, images).
| Name | Status | Population Estimate 2002-07-01 | Population Estimate 2007-07-01 | Population Estimate 2012-07-01 | Population Estimate 2017-07-01 | Population Projection 2023-07-01 | |
|---|---|---|---|---|---|---|---|
| Magallanes y de la Antártica Chilena | Region | 152,394 | 157,141 | 163,877 | 171,293 | 182,217 | |
| Antártica Chilena | Province | 2,293 | 2,146 | 2,092 | 2,086 | 2,121 | → |
| Magallanes | Province | 123,565 | 127,049 | 132,078 | 137,663 | 146,053 | → |
| Tierra del Fuego | Province | 6,666 | 6,965 | 7,431 | 7,910 | 8,527 | → |
| Última Esperanza | Province | 19,870 | 20,981 | 22,276 | 23,634 | 25,516 | → |
| Chile | Republic | 15,691,701 | 16,517,933 | 17,443,491 | 18,419,192 | 19,960,889 |
Source: Instituto Nacional de Estadísticas.
Explanation: All tabulated population figures consider the results of the 2017 census.
Further information about the population structure:
| Gender (P 2023) | |
|---|---|
| Males | 92,686 |
| Females | 89,531 |
| Age Groups (P 2023) | |
|---|---|
| 0-17 years | 38,379 |
| 18-64 years | 118,720 |
| 65+ years | 25,118 |
| Age Distribution (P 2023) | |
|---|---|
| 80+ years | 5,494 |
| 70-79 years | 10,675 |
| 60-69 years | 19,509 |
| 50-59 years | 21,511 |
| 40-49 years | 25,914 |
| 30-39 years | 30,506 |
| 20-29 years | 25,933 |
| 10-19 years | 22,477 |
| 0-9 years | 20,198 |
| Urbanization (C 2017) | |
|---|---|
| Rural | 13,485 |
| Urban | 153,048 |
| Country of Birth (C 2017) | |
|---|---|
| Chile | 161,821 |
| South America | 3,804 |
| Central America & Caribbean | 440 |
| North America | 78 |
| Europe | 285 |
| Other country & undeclared | 105 |