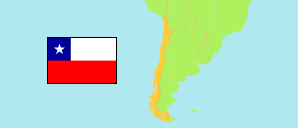
Maule
Region in Chile
Contents: Subdivision
The population development in Maule as well as related information and services (Wikipedia, Google, images).
| Name | Status | Population Estimate 2002-07-01 | Population Estimate 2007-07-01 | Population Estimate 2012-07-01 | Population Estimate 2017-07-01 | Population Projection 2023-07-01 | |
|---|---|---|---|---|---|---|---|
| Maule | Region | 943,174 | 984,607 | 1,035,111 | 1,092,575 | 1,162,641 | |
| Cauquenes | Province | 59,123 | 59,126 | 59,680 | 60,673 | 62,028 | → |
| Curicó | Province | 253,026 | 267,408 | 283,342 | 300,829 | 322,473 | → |
| Linares | Province | 263,521 | 273,621 | 285,423 | 298,858 | 315,332 | → |
| Talca | Province | 367,504 | 384,452 | 406,666 | 432,215 | 462,808 | → |
| Chile | Republic | 15,691,701 | 16,517,933 | 17,443,491 | 18,419,192 | 19,960,889 |
Source: Instituto Nacional de Estadísticas.
Explanation: All tabulated population figures consider the results of the 2017 census.
Further information about the population structure:
| Gender (P 2023) | |
|---|---|
| Males | 569,896 |
| Females | 592,745 |
| Age Groups (P 2023) | |
|---|---|
| 0-17 years | 264,560 |
| 18-64 years | 722,015 |
| 65+ years | 176,066 |
| Age Distribution (P 2023) | |
|---|---|
| 80+ years | 39,552 |
| 70-79 years | 77,770 |
| 60-69 years | 126,940 |
| 50-59 years | 150,230 |
| 40-49 years | 158,562 |
| 30-39 years | 165,839 |
| 20-29 years | 151,092 |
| 10-19 years | 150,626 |
| 0-9 years | 142,030 |
| Urbanization (C 2017) | |
|---|---|
| Rural | 279,819 |
| Urban | 765,131 |
| Country of Birth (C 2017) | |
|---|---|
| Chile | 1,034,170 |
| South America | 6,712 |
| Central America & Caribbean | 2,077 |
| North America | 313 |
| Europe | 1,156 |
| Other country & undeclared | 522 |